Your restaurant is bleeding money right now — and you have no idea where.
You close out the register every night. You look at the total. You think: "Good day" or "Bad day." Then you go home, cross your fingers, and hope next week is better.
That's it. That's the entire analytics strategy for 80% of restaurant owners in America.
Here's the painful truth: that's exactly why 60% of restaurants fail in the first year and 80% close within five years. Not because the food was bad. Not because the location was wrong. Because the owner was flying blind — reacting to problems weeks after they started, instead of catching them on Day 1 when they cost hundreds instead of thousands.
Here's the thing: the data is already sitting in your POS system. Every transaction, every labor hour, every voided check, every table turn. The numbers are there. You're just not looking at them.
That changes today.
This guide covers the 15 KPIs that predict whether your restaurant will be profitable next quarter — or scrambling to make payroll. We'll show you how to calculate each one, what the benchmark should be, and exactly what to do when a number is off. No vague advice. Real math, real targets, real action steps.
The Big 5: Daily Non-Negotiables
These five metrics should be on your desk (or your phone screen) every single morning before you do anything else. Skip them, and you're managing by gut feeling. Gut feeling is expensive.

1. Daily Net Sales
This seems obvious. But it gets worse: most owners look at gross sales and forget to subtract comps, voids, employee meals, and discounts. The number that matters is what actually hits your bank account.
Formula: Gross Sales - Comps - Voids - Employee Meals - Discounts = Net Sales
Benchmark: Compare to the same day last week and the same day last year. A 5% decline week-over-week for two consecutive weeks is a red flag. A 10% decline needs immediate investigation.
What to do when it's off: Break it down by daypart. Is lunch down but dinner steady? That's a different problem than an across-the-board decline. Check if a nearby competitor launched a promotion, if there was a local event that shifted traffic, or if your online ordering volume dropped. Your POS should segment sales by channel — dine-in, takeout, delivery, online — so you can pinpoint exactly where the drop happened.
2. Food Cost Percentage
This is the metric that separates restaurants that survive from restaurants that slowly bleed out. And that's not all: most owners only calculate food cost monthly, which means they discover a $3,000 problem four weeks after it started.
Formula: (Cost of Goods Sold ÷ Net Food Sales) × 100
Benchmark: 28-32% for full-service restaurants. 25-28% for quick-service. If you're above 35%, you are losing money on every plate you serve — even if the dining room is full.
What to do when it's off: Check three things in this order. First, portion sizes — are cooks eyeballing instead of using scales and portioning tools? A 2-ounce overserve on a $14/lb protein across 200 covers is $35/day or $12,775/year gone. Second, waste — run a waste audit and find out what's going into the trash. Third, pricing — when was the last time you updated menu prices to reflect supplier cost increases? Use our food cost calculator to model different scenarios.
3. Prime Cost (The Most Ignored Metric)
Here's the number that makes experienced operators nod and new owners stare blankly. Prime cost is the single most important number in your restaurant, and fewer than 20% of independent operators track it.
Formula: Total Food Cost + Total Beverage Cost + Total Labor Cost (including taxes, benefits, and insurance) = Prime Cost
Benchmark: Under 65% of total revenue. Full-service restaurants should aim for 60-65%. Quick-service should target 55-60%. If your prime cost exceeds 70%, your restaurant is mathematically unable to be profitable unless your rent is nearly free.
But it gets worse: most restaurant owners don't even know their prime cost. They track food cost and labor cost separately and never combine them. That's like checking your oil and your coolant but never looking at the engine temperature gauge. The individual numbers might look acceptable while the combined number is screaming.
What to do when it's off: If prime cost is above 65%, you need to cut from the larger bucket first. If labor is 38% and food is 30%, attack labor — adjust scheduling by daypart, cross-train staff so you need fewer people per shift, and identify overstaffed time blocks. If food cost is the bigger number, revisit your menu engineering — are you pushing high-cost, low-margin items when you should be promoting Stars (high popularity, high profit)?
4. Sales Per Labor Hour (SPLH)
Revenue means nothing if you're burning through labor to generate it. SPLH tells you whether your staffing actually makes financial sense for the volume you're doing.
Formula: Net Sales ÷ Total Labor Hours Worked
Benchmark: $40-$60 for full-service. $25-$35 for quick-service (lower ticket but faster turns). Below $35 in a full-service restaurant means you're overstaffed or underperforming on sales.
Here's the thing: SPLH is most powerful when tracked by daypart and day of week. Your Saturday dinner SPLH might be $75 (great), but your Tuesday lunch might be $22 (you're paying people to stand around). That Tuesday lunch shift is where the money disappears — not in one dramatic moment, but in $150-$200 of excess labor, every Tuesday, 52 weeks a year. That's $7,800-$10,400/year from one bad shift.
What to do when it's off: Pull your POS hourly sales report for the past four weeks. Identify the 15-minute intervals where sales drop below the threshold. Stagger start times so staff arrive when customers do, not when the schedule says. Cut a server from the slow periods and cross-train bussers to cover. Crafty Crab Seafood uses KwickOS across 19 locations with 152 terminals — their managers compare SPLH across all stores in real-time and shift staffing models from high-performing locations to struggling ones.
5. Comp and Void Rate
A small percentage of comps and voids is normal. But when this number creeps up, it's either a training problem or a theft problem. Either way, you're losing real money.
Formula: (Total Comps + Total Voids) ÷ Gross Sales × 100
Benchmark: Under 2% of gross sales. Between 2-4% needs investigation. Above 4% is a serious problem — at $40,000/month in sales, a 5% comp/void rate means $24,000/year walking out your door.
What to do when it's off: Your POS should log who authorized every comp and void. Look for patterns: Is one server voiding 3x more than everyone else? Is the void rate higher on shifts without a manager present? Fingerprint authentication on your POS eliminates shared passwords and "buddy punching" — every void is tied to a specific person. T. Jin China Diner uses fingerprint 1:N authentication across 15 stores and 75 terminals to track exactly who authorizes every comp, discount, and void. No more ghost transactions.
The Weekly 5: Trend Trackers
These metrics are reviewed weekly to catch developing trends before they become crises.
6. Table Turn Rate
But wait — this one metric alone could be hiding thousands in lost revenue.
Formula: Number of Parties Served ÷ Number of Tables
Benchmark: Fine dining: 1-1.5 turns per service. Casual dining: 2-3 turns. Fast casual: 4-6 turns.
A casual restaurant with 30 tables doing 1.5 turns at dinner when the benchmark is 2.5 is leaving 30 tables × 1 missed turn × $45 average check = $1,350 per night on the table. Over a week, that's $9,450 in missed revenue.
What to do when it's off: Time every stage of the dining experience. Where's the bottleneck? If it's between seating and first drink order (more than 3 minutes), it's a server coverage problem. If it's between entree finish and check delivery (more than 5 minutes), it's a checkout workflow problem. If it's between check payment and table reset (more than 4 minutes), it's a bussing problem. Fix the specific bottleneck — don't just tell everyone to "go faster."
7. Revenue Per Available Seat Hour (RevPASH)
RevPASH is the restaurant equivalent of RevPAR in the hotel industry. It measures how efficiently you're monetizing every seat in your dining room during every hour you're open.
Formula: Revenue During Time Period ÷ (Number of Seats × Hours Open During Period)
Benchmark: Varies dramatically by concept. A quick-service spot might target $8-$12 RevPASH. A casual restaurant: $12-$20. Fine dining: $25-$50. The power of RevPASH is not the absolute number — it's the comparison across dayparts.
And that's not all: RevPASH reveals the hidden cost of "dead" dayparts. If your dinner RevPASH is $22 but your 2-5 PM RevPASH is $3, those afternoon hours might actually be costing you money once you factor in labor, utilities, and food prep waste. This is where data drives real decisions — do you close between lunch and dinner, or do you launch a happy hour program to fill those seats?
8. Average Check Size
Now here's where it gets interesting.
Formula: Net Sales ÷ Number of Covers (or Guest Count)
Benchmark: Depends entirely on your concept, but the trend matters more than the number. A declining average check means your servers aren't upselling, your menu mix is shifting toward cheaper items, or customers are cutting back.
What to do when it's off: Compare average check by server. The gap between your best and worst upseller is typically 15-25%. If Server A averages $47/cover and Server B averages $38/cover, that $9 difference across 30 covers per shift is $270/shift. Train Server B to do what Server A does naturally. Your POS should show item-level sales by server so you can see exactly where the upsell gap lives — appetizers, desserts, premium drinks, or add-ons.
9. Customer Count (Traffic)
Formula: Total number of customers served per day/week
Benchmark: Track the trend. If revenue is flat but traffic is declining, you're surviving on higher check averages — which has a ceiling. If traffic grows but revenue doesn't, your check average is dropping — possibly from discounting or menu mix shifts.
This is the "canary in the coal mine" metric. Revenue can mask a traffic problem for months. By the time declining traffic shows up in your bank account, the problem is entrenched. Weekly traffic tracking catches the trend early.
10. Employee Turnover Rate
Formula: (Number of Separations During Period ÷ Average Number of Employees) × 100
Benchmark: The restaurant industry average is 75% annual turnover. Top-performing restaurants maintain 40-50%. Every departure costs $3,500-$5,800 in recruiting, training, and lost productivity. A 20-person staff with 80% turnover means 16 replacements per year — $56,000-$92,800 in hidden costs.
What to do when it's off: Track turnover by position. If you're churning through line cooks but servers stay, it's a BOH culture or compensation problem. If servers leave but kitchen staff stays, investigate management and tip structures. Read our full breakdown of staffing strategies that actually work.
The Monthly 5: Strategic Indicators
Think the daily and weekly numbers are powerful? These monthly metrics are where the real strategic advantage lives.
These metrics inform bigger decisions — menu changes, marketing spend, technology investments, and operational restructuring.
11. Customer Acquisition Cost (CAC)
Formula: Total Marketing Spend ÷ Number of New Customers Acquired
Benchmark: $10-$25 for casual dining. $5-$15 for quick-service. The real question is how CAC compares to customer lifetime value (CLV). If your average customer visits 2.3 times per year with a $42 check, your CLV is roughly $97/year. Spending $20 to acquire that customer is a 4.8x return. Spending $50 is a money loser.
What to do when it's off: Break down CAC by channel. Your Google Business Profile and organic social might drive customers at $3 each, while paid Instagram ads cost $28 each. Kill the expensive channels and double down on what works. If you're spending on third-party delivery commissions (25% to DoorDash adds up fast), consider launching your own online ordering system — KwickOS includes built-in online ordering, and KwickDriver handles delivery at a flat $2 + $6.99 per order instead of 25% commission.
12. Inventory Variance
Formula: (Theoretical Usage Based on Sales - Actual Usage Based on Inventory Count) ÷ Theoretical Usage × 100
Benchmark: Under 2% variance is excellent. 2-5% is acceptable. Above 5% means product is disappearing — through waste, theft, overportioning, or receiving errors.
Here's what most owners miss: a 5% inventory variance on $15,000/month in food purchases is $750/month or $9,000/year. That's pure profit loss. And it accumulates silently because no single incident is large enough to notice.
What to do when it's off: Focus on your top 10 highest-cost ingredients first. Count them weekly instead of monthly. Compare received quantities against invoices (receiving errors are more common than theft). Lock your walk-in and dry storage, and require manager approval for mid-shift pulls.
13. Online vs. In-House Revenue Mix
Formula: Online Revenue (delivery + pickup) ÷ Total Revenue × 100
Benchmark: The industry average is 25-35% online for restaurants that offer it. But the benchmark that matters is profitability by channel. If 30% of your revenue comes from DoorDash at a 25% commission, your effective food cost on those orders is 55-60% — which means you're losing money on every delivery order.
What to do when it's off: If third-party delivery is above 15% of revenue, it's time to build your own channel. Restaurants using KwickOS's built-in online ordering with KwickDriver delivery pay $2 + $6.99 per delivery instead of 15-25% commission. On a $40 order, that's $8.99 vs. $10.00 from DoorDash — and you keep the customer data for remarketing.
14. Marketing ROI by Channel
Formula: (Revenue Attributed to Channel - Marketing Spend on Channel) ÷ Marketing Spend on Channel × 100
Benchmark: Aim for 3x-5x return on marketing spend. Below 2x, the channel isn't worth the effort. Above 5x, increase your budget on that channel.
What to do when it's off: Most restaurant owners can't track this because their marketing data lives in one place and their sales data lives in another. An integrated POS with CRM and loyalty tracking closes this gap. When your POS knows which customers came from which campaign and what they spent, you can calculate true ROI — not just "we posted on Instagram and sales went up."
15. Break-Even Point
Formula: Fixed Costs ÷ (1 - (Variable Costs ÷ Revenue))
Benchmark: You should know your daily break-even sales number by heart. If your fixed costs (rent, insurance, base labor, utilities, subscriptions) are $18,000/month and your variable cost ratio is 40%, your break-even is $30,000/month or roughly $1,000/day.
Every dollar above that number is profit. Every dollar below is loss. Knowing this number transforms how you think about slow days — a $700 Tuesday isn't just "slow," it's a $300 loss that needs to be recovered somewhere else in the week.
How to Actually Track All 15 KPIs (Without Losing Your Mind)
Here's the thing: you can't track 15 KPIs if your data lives in six different systems. Spreadsheets for food cost, a separate payroll system, your POS for sales, a third-party app for online orders, a paper log for waste, and a mental note for everything else.
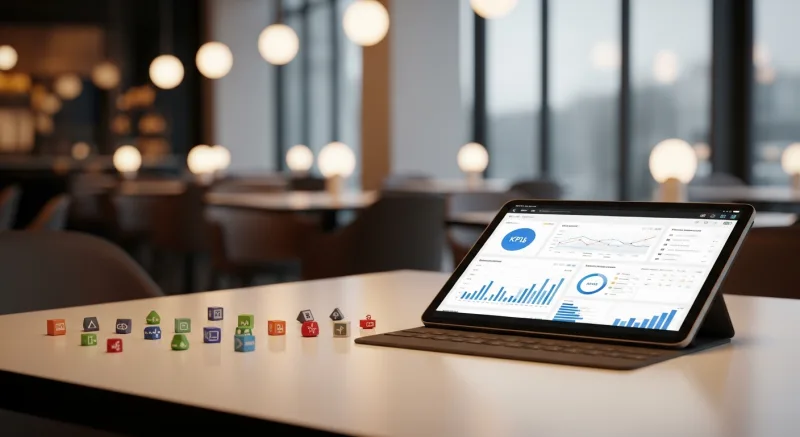
That fragmented approach is why most owners give up on analytics after two weeks. It takes too long and the data never lines up.
The solution is a unified platform where every data point flows into one dashboard. Your POS records sales, labor, comps, and voids. Your inventory module tracks food cost and variance. Your online ordering system feeds revenue by channel. Your CRM calculates customer acquisition and retention.
Crafty Crab Seafood runs 19 locations with 152 terminals on KwickOS. Their managers don't compile spreadsheets — they open one dashboard and see SPLH, food cost, and revenue by location in real-time. When one store's food cost spikes, they catch it the same day and call the kitchen manager, not three weeks later when the monthly P&L arrives.
Shogun Japanese Hibachi went from paper-based tracking to digital KDS and POS analytics. Their operators were proficient in under 5 minutes. That's the difference between a system that collects dust and a system that actually gets used — simplicity.
The Daily, Weekly, Monthly Review Schedule
Don't try to review everything every day. That's overwhelming. Use this cadence:
| Frequency | KPIs to Review | Time Required |
|---|---|---|
| Daily (before opening) | Net Sales, Food Cost %, Prime Cost, SPLH, Comp/Void Rate | 10 minutes |
| Weekly (Monday morning) | Table Turn Rate, RevPASH, Average Check, Customer Count, Employee Turnover | 20 minutes |
| Monthly (1st of month) | CAC, Inventory Variance, Online/In-House Mix, Marketing ROI, Break-Even Analysis | 60 minutes |
10 minutes a day. 20 minutes a week. One hour a month. That's 7.5 hours per month to manage your entire business by data instead of gut feeling. Compare that to the alternative: discovering a $4,000 problem at the end of the quarter that's already cost you $12,000.
What Your POS Should Give You (But Probably Doesn't)
Here's the uncomfortable truth: most POS systems are terrible at analytics. They'll give you end-of-day sales totals. Maybe a labor summary. But real-time SPLH by daypart? RevPASH calculations? Comp/void tracking with biometric authentication? Multi-location comparisons on one screen?
That's where the gap between a cash register with a touchscreen and an actual operating system becomes obvious.
A system like KwickOS was built to surface these numbers automatically because it integrates POS, inventory, scheduling, online ordering, CRM, and delivery into one platform. The data doesn't need to be exported, reconciled, or manually combined. It just appears on your dashboard — and it updates in real-time with 1ms local latency, not 20ms cloud delays that make you wait for the screen to refresh.
Even if your internet drops — and it will, because restaurant WiFi is notoriously unreliable — KwickOS's hybrid local+cloud architecture keeps your POS running and your data recording. When connectivity returns, everything syncs automatically. No lost transactions, no missing data, no blind spots in your analytics.
Compare that to cloud-only systems like Toast or Square, where an internet outage means your analytics go dark and you're back to guessing.
The Bottom Line
You don't need an MBA to run a profitable restaurant. You need 15 numbers, a consistent review schedule, and a system that puts those numbers in front of you without requiring a spreadsheet degree.
The restaurants that survive — the ones that make it past year five and actually build wealth for their owners — are not the ones with the best chef or the trendiest concept. They're the ones where the owner looks at the data every morning, catches problems when they cost $200 instead of $20,000, and makes decisions based on math instead of hope.
Start tomorrow. Pull your POS reports. Calculate your prime cost. Find your SPLH by daypart. Identify the one shift that's costing you the most money. Fix it. Then move to the next number.
That's how restaurants survive. One metric at a time.
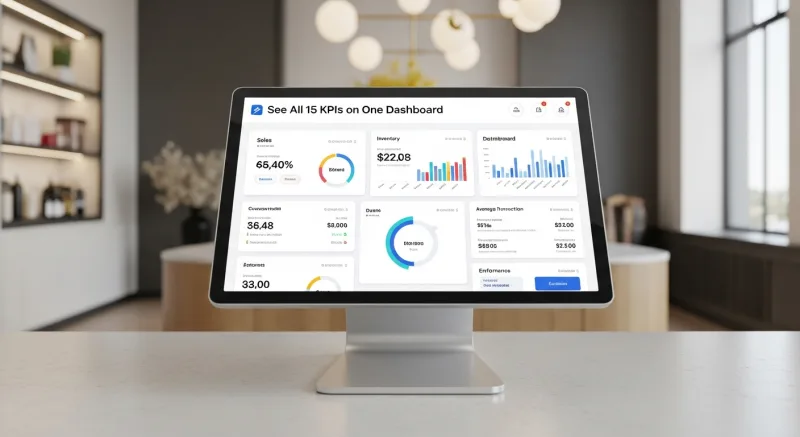
See All 15 KPIs on One Dashboard
KwickOS unifies POS, inventory, labor, online ordering, and CRM into one real-time analytics platform. Stop exporting spreadsheets and start managing by data.
Get a Demo