For restaurant operators, Menu Engineering isn't optional — it's the backbone of daily operations. You spent weeks perfecting your recipes. You agonized over ingredient sourcing. You trained your kitchen staff until every plate came out consistent.
And then you printed a menu that undoes all of it.
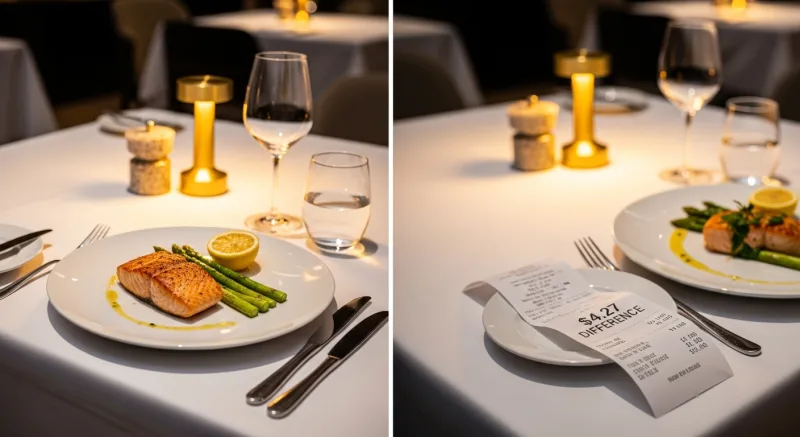
Here is the problem most restaurant owners never see: two items sitting side by side on your menu can have a $4.27 difference in profit per order — and your current layout is actively pushing customers toward the cheaper one. Multiply that by 150 covers a day, 365 days a year, and you are looking at $233,000 in profit you are leaving on the table simply because of how your menu is organized.
But it gets worse. Most restaurants have never run a single menu engineering analysis. They set their menu once, adjust prices when food costs spike, and hope for the best. Meanwhile, chains like McDonald's, Cheesecake Factory, and Denny's spend millions on menu psychology — testing every font, every color, every word, every placement — because they know the menu is the highest-ROI marketing asset in the entire restaurant.
This guide gives you the same framework they use. No million-dollar budget required. Just your POS data, a spreadsheet, and about two hours of focused work.
What Menu Engineering Actually Is (And Why It Works)
Menu engineering is the practice of analyzing each item on your menu by two dimensions — profitability (how much money you make per sale) and popularity (how often it sells) — then redesigning your menu to push customers toward high-profit items without them realizing it.
It was formalized by Michael Kasavana and Donald Smith at Michigan State University in the 1980s, and it remains the most reliable method for increasing restaurant revenue without raising prices, adding seats, or extending hours.
Here's the thing: menu engineering is not about guessing what customers want. It is about reading your own sales data and making surgical changes based on what the numbers tell you.
The average restaurant that completes a full menu engineering cycle sees a 10-15% increase in gross profit within 90 days. For a restaurant doing $80,000/month in revenue, that is $8,000 to $12,000 per month — or $96,000 to $144,000 per year — from rearranging what is already on your menu.
Step 1: Pull Your Data (You Need Exactly 4 Numbers Per Item)
Before you touch your menu design, you need data. Open your POS system and pull a sales mix report for the last 90 days. For every item on your menu, you need:
- Units sold — how many times this item was ordered in the period
- Menu price — what the customer pays
- Food cost — what the ingredients cost you (per serving)
- Contribution margin — menu price minus food cost (this is your profit per item)
If your POS does not give you item-level food cost data, you will need to calculate it manually using your recipes and current ingredient prices. This is the most time-consuming part, but it is the foundation of everything that follows.
And that's not all: you also want to pull this data by daypart if your POS supports it. An item that sells well at dinner but dies at lunch tells you something different than an item that performs consistently across all dayparts.
With KwickOS, you can pull item-level profitability reports with one click — food cost, contribution margin, sales velocity, and time-of-day breakdowns are all built into the reporting dashboard. Crafty Crab Seafood uses this exact data across their 19 locations to run quarterly menu engineering cycles, syncing menu changes to all 152 terminals simultaneously once they have identified which items to promote, reposition, or retire.
Step 2: Build the Menu Engineering Matrix
Now comes the framework that changes everything. Every item on your menu falls into one of four categories based on two axes: contribution margin (high vs. low) and sales volume (high vs. low).
| High Popularity | Low Popularity | |
|---|---|---|
| High Profit | Stars — Keep and promote | Puzzles — Reposition and market |
| Low Profit | Plow Horses — Reengineer or reprice | Dogs — Remove or replace |
To classify your items, calculate two thresholds:
- Average contribution margin: Add up the contribution margin of every item and divide by the number of items. Items above this number are "high profit."
- Popularity threshold: Calculate the expected popularity if every item sold equally (100% divided by the number of items), then multiply by 0.7. Items that sell above this threshold are "high popularity."
Now plot every single item. Here is what a real analysis might look like for a 35-item menu:
| Item | Price | Food Cost | CM | Units (90d) | Category |
|---|---|---|---|---|---|
| Grilled Salmon | $24.99 | $7.50 | $17.49 | 847 | Star |
| Chicken Parmesan | $18.99 | $4.20 | $14.79 | 1,203 | Star |
| House Burger | $14.99 | $5.80 | $9.19 | 1,456 | Plow Horse |
| Lobster Risotto | $28.99 | $11.20 | $17.79 | 189 | Puzzle |
| Garden Salad | $10.99 | $3.40 | $7.59 | 312 | Dog |
Most restaurant owners are shocked when they see this matrix for the first time. The item they assumed was their "best seller" (the burger, because it moves the most units) is actually a Plow Horse — popular but low-margin. Meanwhile, the Lobster Risotto they barely think about is a Puzzle generating $17.79 per order that almost nobody is ordering.
That is a $8.60 profit gap between the item customers are choosing and the item you want them to choose. And your menu layout is the reason.
Step 3: The Strategy for Each Category
Stars: Protect and Promote
Stars are your moneymakers. They are profitable and popular. Your only job is to make sure nothing changes.
- Give Stars the best real estate on your menu (more on placement in the next section)
- Do not change the recipe, portion size, or price unless food costs force you to
- Use Stars in your marketing — photos, social media, server recommendations
- Consider creating variations (Star item as a combo, as a special, as a family size) to capture more occasions
Plow Horses: Reengineer for Margin
Plow Horses are popular but unprofitable. Customers love them, but you are barely making money on each sale. Here is how to fix them without killing the popularity:
- Reduce portion size slightly — a 10% reduction in protein weight is rarely noticed by customers but drops food cost meaningfully
- Substitute cheaper ingredients — swap one garnish, use a different oil, switch from brand-name to comparable quality
- Raise the price by $1-2 — pair this with improved presentation or a new description so it feels like an upgrade, not a price hike
- Bundle with high-margin sides — "Add soup or salad for $3.99" where your soup costs $0.60 to make
- Move them to less prominent menu positions — they will still sell (they are popular), but they will not be the first thing customers see
Puzzles: Reposition and Sell Harder
Puzzles are your biggest opportunity. These items are highly profitable but nobody is ordering them. The product is good — the marketing is bad. Fix the marketing:
- Move Puzzles to high-visibility positions — top right of the menu, inside a box or callout, with a "Chef's Pick" label
- Rewrite the description — use sensory language, tell a story, mention the cooking technique (see the description section below)
- Add a photo — items with photos sell 30% more than items without
- Have servers recommend them — train your team with a specific script: "The lobster risotto is incredible tonight — chef uses a 45-minute reduction that makes the sauce unbelievable"
- Consider lowering the price slightly — if the item has high contribution margin, a $2 price cut might 3x the order volume while still being your most profitable item per sale
Dogs: Remove or Reimagine
Dogs are low-profit and low-popularity. They are taking up space on your menu, adding complexity to your kitchen, and contributing almost nothing to your bottom line.
- Remove them. Most restaurants have 3-5 Dogs that no one would miss. Cutting them simplifies your inventory, reduces waste, and makes your kitchen faster.
- If you cannot remove them (because they serve a dietary need or a specific customer segment), hide them — bottom of the menu, no description, no photo, smallest font.
- Consider reimagining — can the Dog be reformulated with cheaper ingredients and a higher price? If not, let it go.
Shogun Japanese Hibachi used this exact matrix when redesigning their menu. By identifying three underperforming Dogs (items that sold fewer than 5 per week with margins under $6) and replacing them with two new Puzzle-candidates at higher price points, they increased average check size by $3.80 within two weeks — with no additional food cost and no pushback from regulars. Their KwickOS KDS displayed the new items on customized station screens, and staff were proficient with the changes in under 5 minutes.
Step 4: Menu Layout Psychology (Where You Put Things Matters More Than What They Are)
Your menu is not read like a book. Eye-tracking studies reveal consistent patterns in how customers scan menus, and smart placement exploits these patterns to drive orders toward your Stars and Puzzles.
The Golden Triangle
On a single-page or two-panel menu, customers' eyes follow a predictable path: center first, then upper right, then upper left. This is the "Golden Triangle," and your highest-margin items should live here.
On a three-panel menu, the sweet spot shifts to the center panel, upper half. That is where your most profitable category should appear.
The Anchor Effect
Place your most expensive item at the top of each category. It sets a price anchor in the customer's mind, making everything below it feel like a deal. A $38 steak at the top makes a $24 salmon feel reasonable — even though the salmon carries a higher contribution margin.
Here's the thing: the $38 steak does not need to sell well. Its job is to make the $24 salmon look like smart money. This is pure behavioral economics, and it works every time.
Boxing and Callouts
Items inside a box, a shaded area, or next to an icon ("Chef's Favorite," "Most Popular") receive 2-3x more attention than items in a plain list. Use this for your Stars and Puzzles — never for Plow Horses or Dogs.
The Decoy Strategy
Place a slightly overpriced item next to your target item. If your goal is to sell the $22 pasta (your Star), put a $26 pasta right next to it that is only marginally different. The $26 option makes the $22 one feel like the smart choice. You do not need the $26 item to sell — you need it to make the $22 item sell more.
Step 5: Write Descriptions That Sell (Not Just Describe)
A menu item with no description sells at its baseline rate. A menu item with a well-written description sells 27% more, according to research from Cornell University's Center for Hospitality Research.
But most menu descriptions are terrible. "Grilled chicken breast with seasonal vegetables and mashed potatoes" tells the customer nothing they could not already guess. It does not make them hungry. It does not differentiate your chicken from the chicken at the restaurant next door.
Compare:
| Before | After |
|---|---|
| "Grilled salmon with rice and vegetables" | "Wild-caught Atlantic salmon, cedar-plank grilled and finished with a honey-miso glaze. Served over jasmine rice with wok-charred broccolini." |
| "Chicken pasta" | "Hand-pulled fettuccine tossed in a slow-simmered San Marzano cream sauce with herb-crusted chicken thigh and shaved Parmigiano." |
The rules for profitable descriptions:
- Use sensory adjectives — "crispy," "slow-roasted," "hand-pulled," "wood-fired," "caramelized"
- Name the origin or technique — "San Marzano tomatoes," "48-hour brined," "stone-ground" — specificity signals quality
- Keep it to 2-3 lines — enough to create desire, not so much that it slows down ordering
- Skip descriptions for Dogs — if you must keep a Dog on the menu, let it sit without a description to minimize attention
- Write in the customer's language — if you serve a multilingual customer base, descriptions in their language dramatically increase comfort and order frequency
And that's not all: your POS system should make it easy to update descriptions across digital menus, kiosks, and online ordering without touching each device individually. Tiger Sugar uses KwickOS to manage descriptions in English and Chinese across 2 stores and 2 self-ordering kiosks — when they optimize a description, it updates everywhere in seconds, not hours.
Step 6: Pricing Psychology (Stop Using .99 on Everything)
How you display your prices affects what people order. Here are the evidence-based rules:
- Drop the dollar sign. Cornell research shows removing the "$" increases average spending by 8%. Use "24" instead of "$24.00."
- Do not use price columns. When prices are aligned in a column, customers scan the column and pick the cheapest option. Nest the price at the end of the description so it flows naturally.
- Use whole numbers or .95 for upscale. "$24" or "24.95" feels more premium than "$23.99." Save .99 pricing for quick-service and casual chains.
- Never use dotted lines from item to price. Those lines (Lobster Risotto........$28.99) scream "diner" and draw the eye directly to the price, which is the opposite of what you want.
One pricing move that pays for itself immediately: raise prices on your Stars by $0.50 to $1.00. Stars are already popular — a small price increase rarely affects order volume but drops straight to your bottom line. On a Star that sells 40 units per day, a $0.75 price increase generates $10,950 in additional annual profit with zero additional cost.
Step 7: Use Your POS Data to Measure and Iterate
Menu engineering is not a one-time project. It is a quarterly discipline. Here is the cycle:
- Month 1: Pull 90-day sales mix data, build the matrix, identify Stars/Plow Horses/Puzzles/Dogs
- Month 2: Redesign the menu — layout, descriptions, pricing, placement — and deploy
- Month 3: Measure the impact — compare sales mix, average check, and contribution margin to the previous quarter
- Repeat — each cycle gets more refined as you accumulate data on what works for your specific customer base
The key is having a POS system that makes this data accessible without a PhD in spreadsheets. You need item-level sales reports with food cost breakdowns, contribution margin by item, sales velocity by daypart, and ideally server-level data to see which team members are successfully upselling your Stars.
T. Jin China Diner runs this cycle across all 15 locations using KwickOS's centralized reporting. Their management team pulls a single multi-location sales mix report, identifies which items are performing differently across locations, and deploys menu updates to all 75 terminals remotely. A Star in their downtown location might be a Puzzle in the suburbs — and their menu strategy adapts accordingly.
The $4.27 Difference: Putting It All Together
Let us revisit the number from the headline. Consider two scenarios for a restaurant doing 150 covers per day:
| Before Menu Engineering | After Menu Engineering | |
|---|---|---|
| Average contribution margin per entree | $11.20 | $15.47 |
| Daily profit (150 covers) | $1,680 | $2,320 |
| Monthly profit | $50,400 | $69,615 |
| Annual profit | $604,800 | $835,380 |
| Annual difference | $230,580 |
A $4.27 improvement in average contribution margin — achieved through better placement, smarter descriptions, strategic pricing, and removing Dogs — translates to over $230,000 in additional annual profit. No new menu items. No new equipment. No new staff. Just a better-designed menu informed by data.
That is the power of menu engineering. And every restaurant that is not doing it is leaving that money on the table.
Common Menu Engineering Mistakes to Avoid
Even restaurants that attempt menu engineering make critical errors:
- Using food cost percentage instead of contribution margin. A $10 item with 25% food cost makes you $7.50. A $30 item with 35% food cost makes you $19.50. Which one do you want to sell more? Contribution margin — dollars in your pocket — is the metric that matters, not percentage.
- Too many items. Research from the Culinary Institute of America shows that menus with more than 7-10 items per category cause decision fatigue, which leads to customers defaulting to what they know (usually a Plow Horse). Trim your menu to reduce complexity and increase the odds that customers pick your Stars.
- Ignoring beverages. Drinks typically carry 75-85% margins. A $9 cocktail that costs $1.80 to make is a $7.20 contribution margin — often higher than your best entree. Apply the same engineering framework to your drink menu.
- Engineering the menu once and forgetting. Ingredient costs change. Customer preferences shift. New competitors open. Run the analysis quarterly, or at minimum every time you adjust prices or change seasonal offerings.
- Not training servers. The best-designed menu in the world fails if your servers default to recommending the burger when asked "what's good?" Train them to recommend Stars by name, with a one-sentence pitch.
Your Menu Engineering Action Plan
You do not need to overhaul everything at once. Here is a practical sequence that most restaurants can complete in two weeks:
- Day 1-2: Pull your POS data and calculate contribution margins for every item
- Day 3: Build the matrix and classify every item as Star, Plow Horse, Puzzle, or Dog
- Day 4-5: Identify your top 3 Puzzles and write new descriptions for each
- Day 6-7: Redesign your menu layout — move Stars and Puzzles to prime positions, demote Plow Horses and Dogs
- Day 8-10: Price adjustments — raise Stars by $0.50-$1.00, consider lowering Puzzle prices by $1-2
- Day 11-12: Train servers on the new menu, focusing on Puzzle recommendations
- Day 14: Launch the new menu and start tracking results
Use our food cost calculator to quickly determine contribution margins, or see how KwickOS compares to other POS systems for the reporting features you need to make data-driven menu decisions. If you are running multiple locations, our multi-location management guide shows how centralized menu engineering works at scale.
Turn Your Menu Into a Profit Machine
KwickOS gives you item-level profitability data, one-click menu updates across all locations, and the reporting tools to run quarterly menu engineering cycles. See how it works.
Get a Demo