
For restaurant operators, Conduct a Restaurant Waste Audit and Save Thousands isn't optional — it's the backbone of daily operations. Open your walk-in cooler right now. Look at the back of the bottom shelf.
See that container of prep from three days ago? The wilting produce behind the new delivery? The protein that's technically still good but won't be by tomorrow's dinner rush?
That's money. Your money. And it's about to become garbage.
The average full-service restaurant throws away between 25,000 and 75,000 pounds of food every year. At an average food cost of $3-$5 per pound, that's $15,000 to $25,000 annually going straight into the dumpster. For a restaurant operating on 5-8% net margins, that wasted food represents $200,000 to $500,000 in revenue you'd need to generate just to cover the loss.
Here's the thing: most owners know they have waste. They can feel it. But they have no idea how much, where it's coming from, or what to do about it. They've accepted food waste as a cost of doing business — like processing fees or rent.
It's not. It's the most fixable expense on your P&L. And it starts with seven days and a kitchen scale.
Why Guessing Doesn't Work (And Why a Formal Audit Does)
Every restaurant owner has tried the "keep an eye on it" approach to food waste. Walk through the kitchen, glance at the trash cans, remind the prep cook not to over-cut the onions.
It doesn't work. Here's why.
Food waste in a restaurant happens across dozens of small moments throughout every shift. A cook trims 15% more off a filet than necessary. The prep team makes 20% more rice than the dinner rush needs. A server enters the wrong modification and the dish gets remade. A case of avocados ripens faster than expected and half goes brown.
No single one of these events feels significant. A half-pound here, a quart there. But they compound. A restaurant doing $1.2 million in annual revenue with a 32% food cost is spending $384,000 on food. If 7% of that is wasted — a conservative mid-range estimate — that's $26,880 per year. Thrown away.
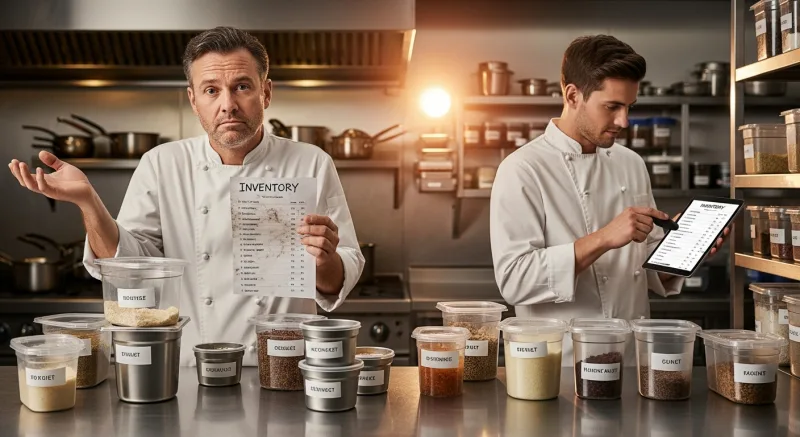
But it gets worse: you can't fix what you can't see. Without data, you're making changes based on intuition. Maybe you crack down on portion sizes, annoying your best cook. Maybe you reduce prep quantities, and you run out during the Saturday rush. Maybe you switch suppliers to save on cost, and quality drops.
A waste audit replaces guessing with facts. Seven days of measurement tells you exactly which category of waste is costing you the most, which shifts produce the most waste, and which specific items are the biggest offenders. Then you fix the real problems — and only the real problems.
The 7-Day Waste Audit: Step by Step
This isn't complicated. It doesn't require consultants, special software, or expensive equipment. You need a kitchen scale, some bins, a clipboard, and one week of discipline.
Day 0: Set Up Your Tracking System
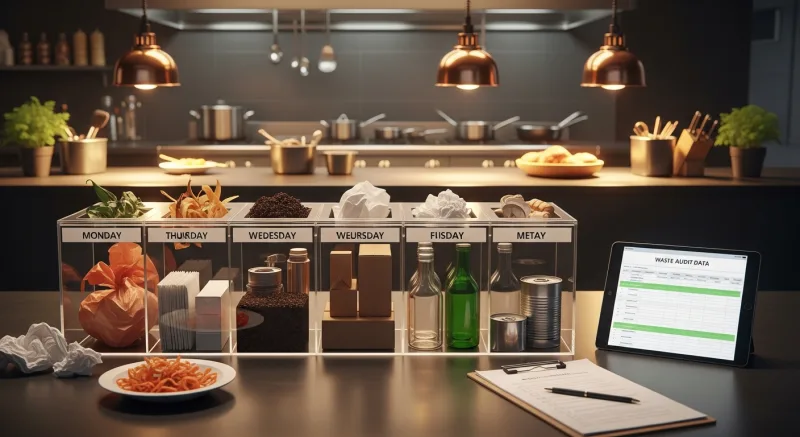
Before the audit week begins, set up four clearly labeled waste bins in your kitchen:
- Bin 1: Prep Waste — Trimmings, peels, stems, fat, bones, and anything removed during food preparation. This is the waste that happens before food hits the pan.
- Bin 2: Spoilage — Items that expired, went bad, or deteriorated past usability. This includes walk-in items past their date, produce that wilted, dairy that turned, and proteins that were never used in time.
- Bin 3: Overproduction — Food that was cooked or prepped but never served. Buffet leftovers, excess batch prep, soups that didn't sell, and daily specials that sat in the window too long.
- Bin 4: Plate Returns — Food that was served to customers but came back uneaten. Untouched sides, bread baskets, garnishes, and wrong-order remakes.
Place a clipboard next to each bin with a simple log sheet. Columns: date, shift (AM/PM), item name, estimated weight, estimated cost per pound, and reason. The reason column is critical — "made too much rice" is actionable; "rice" is not.
Brief your entire kitchen staff. Explain what you're doing, why it matters, and that this is about fixing systems — not blaming people. And that's not all: the teams that understand the "why" behind the audit consistently log 3x more data than teams that are just told to "track waste."
Days 1-7: Track Everything
For seven consecutive days (ideally Monday through Sunday to capture the full weekly cycle), every piece of food waste goes into the correct bin. At the end of each shift, the closing manager weighs each bin, records the total on the master tracking sheet, and empties the bins.
Key rules for accurate tracking:
- Weigh before discarding. Every item gets weighed. No exceptions. The five seconds it takes to step on the scale is the difference between usable data and guesswork.
- Name the item. "Chicken" is better than nothing. "Grilled chicken breast — overcooked" is what actually helps you fix the problem.
- Note the reason. Was it over-prepped? Did it expire? Was it a wrong order? Was the portion too large and the customer left half? Each reason points to a different solution.
- Track every shift separately. Lunch and dinner waste patterns are often completely different. A restaurant might have near-zero lunch waste but massive dinner overproduction.
Here's a tip that most guides miss: photograph the bins before emptying. A picture of a bin full of perfectly good-looking chicken breast trim tells a story that numbers alone don't. These photos become your most powerful tool when you sit down to make changes.
Day 8: Analyze and Act
Now you have data. Here's how to turn it into savings.
Start by calculating your total waste by category:
| Category | Typical % of Total Waste | Example (7-Day Total) | Annualized Cost |
|---|---|---|---|
| Prep waste | 30-40% | 185 lbs | $7,400 |
| Spoilage | 25-35% | 140 lbs | $8,200 |
| Overproduction | 20-25% | 110 lbs | $6,800 |
| Plate returns | 10-15% | 65 lbs | $3,600 |
| Total | 100% | 500 lbs | $26,000 |
Then rank your top 10 wasted items by cost. This is where the real surprises show up. Most restaurant owners expect produce to be their biggest waste category. In practice, it's often proteins — because proteins are expensive per pound and spoilage is harder to spot until it's too late.
Fixing the Four Types of Waste
Each waste category has specific, proven solutions. Let's break them down.
1. Prep Waste: The Trim That Eats Your Margins
Prep waste is the most "accepted" form of waste. Owners see trimmings as inevitable. But the difference between a 15% trim loss and a 25% trim loss on a case of beef tenderloin is $47 per case. Multiply that by your weekly orders.
Fixes:
- Standardize cutting specs. Create photo guides showing exactly how each protein, vegetable, and fruit should be trimmed. Post them at every prep station. A line cook who knows the trim standard for salmon wastes 8-12% less than one who's guessing.
- Cross-utilize trim. Chicken trim becomes stock. Vegetable ends become soup base. Bread heels become croutons or breadcrumbs. Every restaurant that reduces prep waste has a "trim menu" — a list of secondary uses for every primary trim item.
- Invest in knife skills training. One afternoon of knife skills training for your prep team can reduce vegetable prep waste by 15-20%. That's not hyperbole — it's the consistent finding across waste audit studies.
2. Spoilage: The Silent Killer in Your Walk-In
Spoilage waste is almost entirely preventable. It comes from three sources: over-ordering, poor rotation, and inadequate storage. And the fix for all three is the same four letters: FIFO.
First In, First Out means older inventory is always used before newer inventory. It sounds obvious. In practice, fewer than 30% of independent restaurants enforce it consistently.
Fixes:
- Date-label everything on arrival. Every item that enters your walk-in gets a date label — the date it was received, not the supplier's pack date. Use color-coded day-of-week labels (available for under $20/month) so expired items are visually obvious.
- New stock goes behind old stock. Always. This is the core of FIFO. When a delivery arrives, existing inventory moves forward and new product goes to the back. Train your receiving staff to do this automatically — it adds 5 minutes to the put-away process and saves thousands per year.
- Set par levels based on actual sales data. Over-ordering is the number one cause of spoilage. If your POS tracks daily sales mix, use that data to set par levels for every perishable item. A restaurant that orders based on Tuesday's actual chicken usage — not a manager's gut feeling — cuts spoilage by 30-50%.
This is where technology makes a measurable difference. Crafty Crab Seafood, which operates 19 locations with 152 terminals on KwickOS, uses real-time inventory tracking to sync par levels across all stores. When one location's crab leg sales spike on a Friday, the system adjusts the next order automatically. Before implementing automated inventory alerts, their spoilage rate was 6.2%. After: 2.8%. That's $43,000 in annual savings across the chain.
3. Overproduction: Cooking Food Nobody Orders
Overproduction waste is the most expensive per pound because the food has already been cooked — meaning you've spent labor, energy, and ingredients on it. A pan of overproduced soup costs you the ingredients plus 15-20 minutes of cook time plus the gas or electricity to prepare it.
Fixes:
- Batch in smaller quantities. Instead of prepping a full hotel pan of rice at 4 PM, prep a half pan and reassess at 6 PM. Yes, this requires one more trip to the rice cooker. It also prevents 4 pounds of rice from being thrown away every night.
- Use sales forecasting. Your POS system knows exactly how many covers you did last Tuesday, last month, and last year. Use that data. A KwickOS sales mix report shows you not just how many customers came in, but what they ordered. If you sold 12 orders of clam chowder last Tuesday and 14 the Tuesday before, making 3 gallons "just in case" is overproduction.
- Implement a daily special rotation for excess items. When you have surplus prepped ingredients approaching their use-by window, turn them into a daily special. This converts potential waste into revenue. A $14 "chef's special" made from $3 of about-to-expire ingredients is a 78% margin — your most profitable item on the menu.
4. Plate Returns: What Customers Tell You Without Saying a Word
Plate return waste is the smallest category by weight but the most informative. When food comes back uneaten, it's direct feedback about your portions, your menu, and your execution.
Fixes:
- Audit your portion sizes against plate return data. If customers consistently leave half the rice, you're serving too much rice. Reduce the portion by 25%, save on food cost, and nobody complains because they weren't eating it anyway.
- Track remake reasons. Every remade dish should be logged with the reason — wrong temp, wrong modification, wrong table, quality issue. If 40% of your remakes are modification errors, that's a training and POS workflow problem, not a kitchen problem. Systems like KwickOS display modifications prominently on the kitchen display system, reducing missed-mod remakes significantly. Shogun Japanese Hibachi reduced their remake rate by customizing their KDS station displays — their cooks could see exactly which items went to which station, and new staff were proficient in under 5 minutes.
- Eliminate untouched garnishes. If your parsley garnish comes back untouched on 95% of plates, stop putting it on plates. That's $800-$1,200 per year in parsley alone. Multiply that across every decorative-only element on your plates.
Building a Waste Prevention System That Lasts
A one-time audit finds the problems. A system prevents them from coming back. Here's how to build waste prevention into your daily operations.
Daily Waste Log (5 Minutes Per Shift)
After the initial 7-day audit, transition to a simplified daily waste log. You don't need four bins anymore — just one waste log sheet that the closing manager fills out in 5 minutes. Track the top 5 waste items by dollar value, the total estimated waste in pounds, and any unusual events (power outage, delivery error, unexpectedly slow night).
This ongoing tracking is what separates restaurants that save money once from restaurants that save money permanently. T. Jin China Diner, managing 15 locations and 75 terminals through KwickOS, runs digital waste tracking across every store. Their managers log waste data into the POS at close, and the owner reviews all 15 locations' waste reports from a single dashboard the next morning — without visiting a single store. When waste spikes at one location, they know within 24 hours, not 24 days.
Weekly Inventory Counts
You already do inventory counts (or you should be — see our inventory management guide). Connect your waste audit data to your inventory counts. If your theoretical food cost based on sales mix is 30% and your actual food cost is 34%, that 4% gap is a combination of waste, theft, and portioning errors. The waste audit tells you exactly how much of that gap is waste.
With a POS that tracks ingredient-level inventory — not just item-level sales — you can automate this comparison. KwickOS maps every menu item to its recipe, so when you sell a burger, the system deducts the bun, patty, lettuce, tomato, and condiments from inventory automatically. The gap between theoretical and actual inventory is your waste plus variance, and you can drill into it by ingredient.
Monthly Waste Review
Once per month, review your waste trends. Are they going down? Holding steady? Creeping back up? Compare month-over-month and look for patterns:
- Does waste spike on certain days of the week? (Mondays after weekend deliveries are common.)
- Does a specific shift produce more waste? (Often a training issue with particular staff.)
- Are certain menu items consistently wasted? (Consider removing or reformulating them — menu engineering can help.)
- Did a supplier change correlate with increased spoilage? (Shelf life varies between suppliers.)
The Composting Revenue Opportunity
Even after you minimize waste, some food waste is unavoidable — coffee grounds, eggshells, bones, and vegetable trimmings that can't be cross-utilized. But that doesn't mean it has to cost you money.
Commercial composting programs are expanding rapidly. In many cities, diverting food waste from landfills to composting facilities can reduce your waste hauling costs by 20-40% because compostable waste is lighter and cheaper to process than mixed refuse. Some municipalities offer free compost pickup for commercial businesses.
In California, SB 1383 requires all businesses generating more than 2 cubic yards of waste per week to separate organic waste for composting. Non-compliance fines start at $50 per day and increase to $500 per day for repeat violations. Similar legislation is active or pending in Vermont, Massachusetts, Connecticut, New York, and several other states.
And that's not all: some restaurants have turned composting into a marketing advantage. Customers increasingly prefer businesses with visible sustainability practices. A simple note on your menu — "We compost 100% of our food waste" — resonates with the 66% of consumers who say they're willing to pay more at environmentally responsible restaurants.
Technology That Makes Waste Tracking Automatic
Manual waste tracking works. Automated waste tracking works better and lasts longer, because it doesn't depend on a manager remembering to fill out a clipboard at the end of a 12-hour shift.
Here's what to look for in a POS system that supports waste reduction:
- Real-time inventory tracking. The system should deduct ingredients from inventory as items are sold, giving you a running count of what you have and what you need. This prevents over-ordering — the root cause of spoilage waste.
- Automated par level alerts. When inventory drops below par, the system should notify you. When inventory exceeds par (because a delivery arrived and you still have yesterday's stock), it should also notify you — because that's a spoilage risk.
- Sales mix analysis. Which items sell on which days? How does weather affect your sales mix? A system that tracks this data over time can predict Tuesday's chicken usage with 90%+ accuracy after just 8-12 weeks of data.
- Waste logging in the POS. Ideally, you log waste directly in your POS system rather than on a clipboard. This lets you run reports that combine waste data with sales data and inventory data — a complete picture of your food cost efficiency.
- Multi-location waste comparison. If you operate multiple locations, you need to compare waste performance across stores. Which location has the lowest spoilage rate? What are they doing differently? This is exactly how Crafty Crab Seafood used KwickOS across their 19 stores — they identified that one location had 60% less produce waste than the others, investigated, discovered the chef was cross-utilizing herb stems in stocks, and rolled that practice out chain-wide.
The key is choosing a system that integrates waste tracking with everything else — inventory, sales, purchasing, and analytics. Standalone waste tracking apps exist, but they create another data silo. When waste data lives inside your POS alongside your sales data and inventory data, the insights are dramatically more useful.
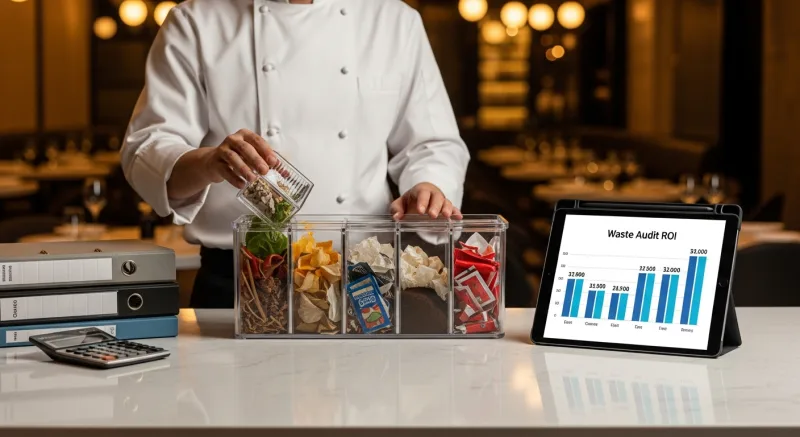
The ROI of a Waste Audit: Real Numbers
Let's put concrete numbers on what a waste audit program can save, using three restaurant profiles:
| Small Restaurant ($600K/yr revenue) | Mid-Size Restaurant ($1.5M/yr revenue) | Multi-Location (5 stores, $6M/yr revenue) | |
|---|---|---|---|
| Annual food purchases | $192,000 | $480,000 | $1,920,000 |
| Waste before audit (est. 7%) | $13,440 | $33,600 | $134,400 |
| Waste after fixes (est. 3%) | $5,760 | $14,400 | $57,600 |
| Annual savings | $7,680 | $19,200 | $76,800 |
| Equivalent revenue needed (at 6% margin) | $128,000 | $320,000 | $1,280,000 |
Read that last row again. A mid-size restaurant would need to generate $320,000 in additional revenue to match the profit impact of reducing waste from 7% to 3%. Saving $19,200 in waste costs zero in marketing, zero in additional labor, and zero in additional rent. It's pure profit recovery.
Compare that to the cost of the audit itself: one week of tracking (a few hours of manager time), a $30 kitchen scale, and some bins and labels. The ROI is not 10x or 50x. It's effectively infinite — the investment is negligible and the returns compound every month.
The Waste-Processing Fee Connection Most Owners Miss
Here's a pattern interrupt most operators don't consider: waste reduction and processing fee savings attack the same problem from different angles. Both are margin recoveries that require zero additional revenue.
A restaurant saving $4,000/year by switching to a processor-agnostic POS and $19,000/year from waste reduction has just recovered $23,000 in pure profit. At a 6% net margin, that's the equivalent of growing revenue by $383,000 — without serving a single additional customer.
This is why choosing the right operating system for your restaurant matters more than any single marketing initiative. A platform like KwickOS that gives you both processor freedom (saving $3,000-$8,000/year) and integrated inventory tracking (enabling the waste reduction that saves $7,000-$20,000+/year) delivers compound savings that locked-in systems simply cannot match.
Want to see how much you're overpaying on processing fees? Our processing fee calculator takes 30 seconds and shows you the exact number. Then pair that with a waste audit, and you've found $15,000-$30,000 in annual savings that are already yours — just waiting to stop being thrown away.
Your 7-Day Waste Audit Checklist
Ready to start? Here's everything you need:
- Get a kitchen scale ($25-50, digital, reads in pounds and ounces)
- Set up 4 labeled bins (Prep, Spoilage, Overproduction, Plate Returns)
- Print tracking sheets (Date, Shift, Item, Weight, Cost/lb, Reason)
- Brief your team (Explain the why, emphasize systems not blame)
- Track for 7 full days (Monday-Sunday, weigh at end of every shift)
- Photograph bins daily (Visual evidence drives change)
- Analyze on Day 8 (Total by category, rank top 10 items by cost)
- Implement your top 3 fixes (Start with the biggest dollar impact)
- Set up ongoing daily tracking (5-minute closing manager task)
- Review monthly (Compare trends, adjust par levels, refine processes)
The restaurants that thrive on thin margins aren't the ones that work harder. They're the ones that stop bleeding money from preventable waste — and a 7-day audit is where every one of them started.
Track Waste, Inventory, and Sales in One System
KwickOS integrates waste logging with real-time inventory tracking and sales analytics — so you can spot waste patterns and fix them before they cost you thousands.
Get a Demo