See Everything. Miss Nothing.
Real-Time Reports & Analytics
Real-time dashboards, P&L reports, labor costs, sales trends — accessible from anywhere on any device. Know exactly what's happening across every location, every shift, every hour.
 verified 5,000+ Active Merchants
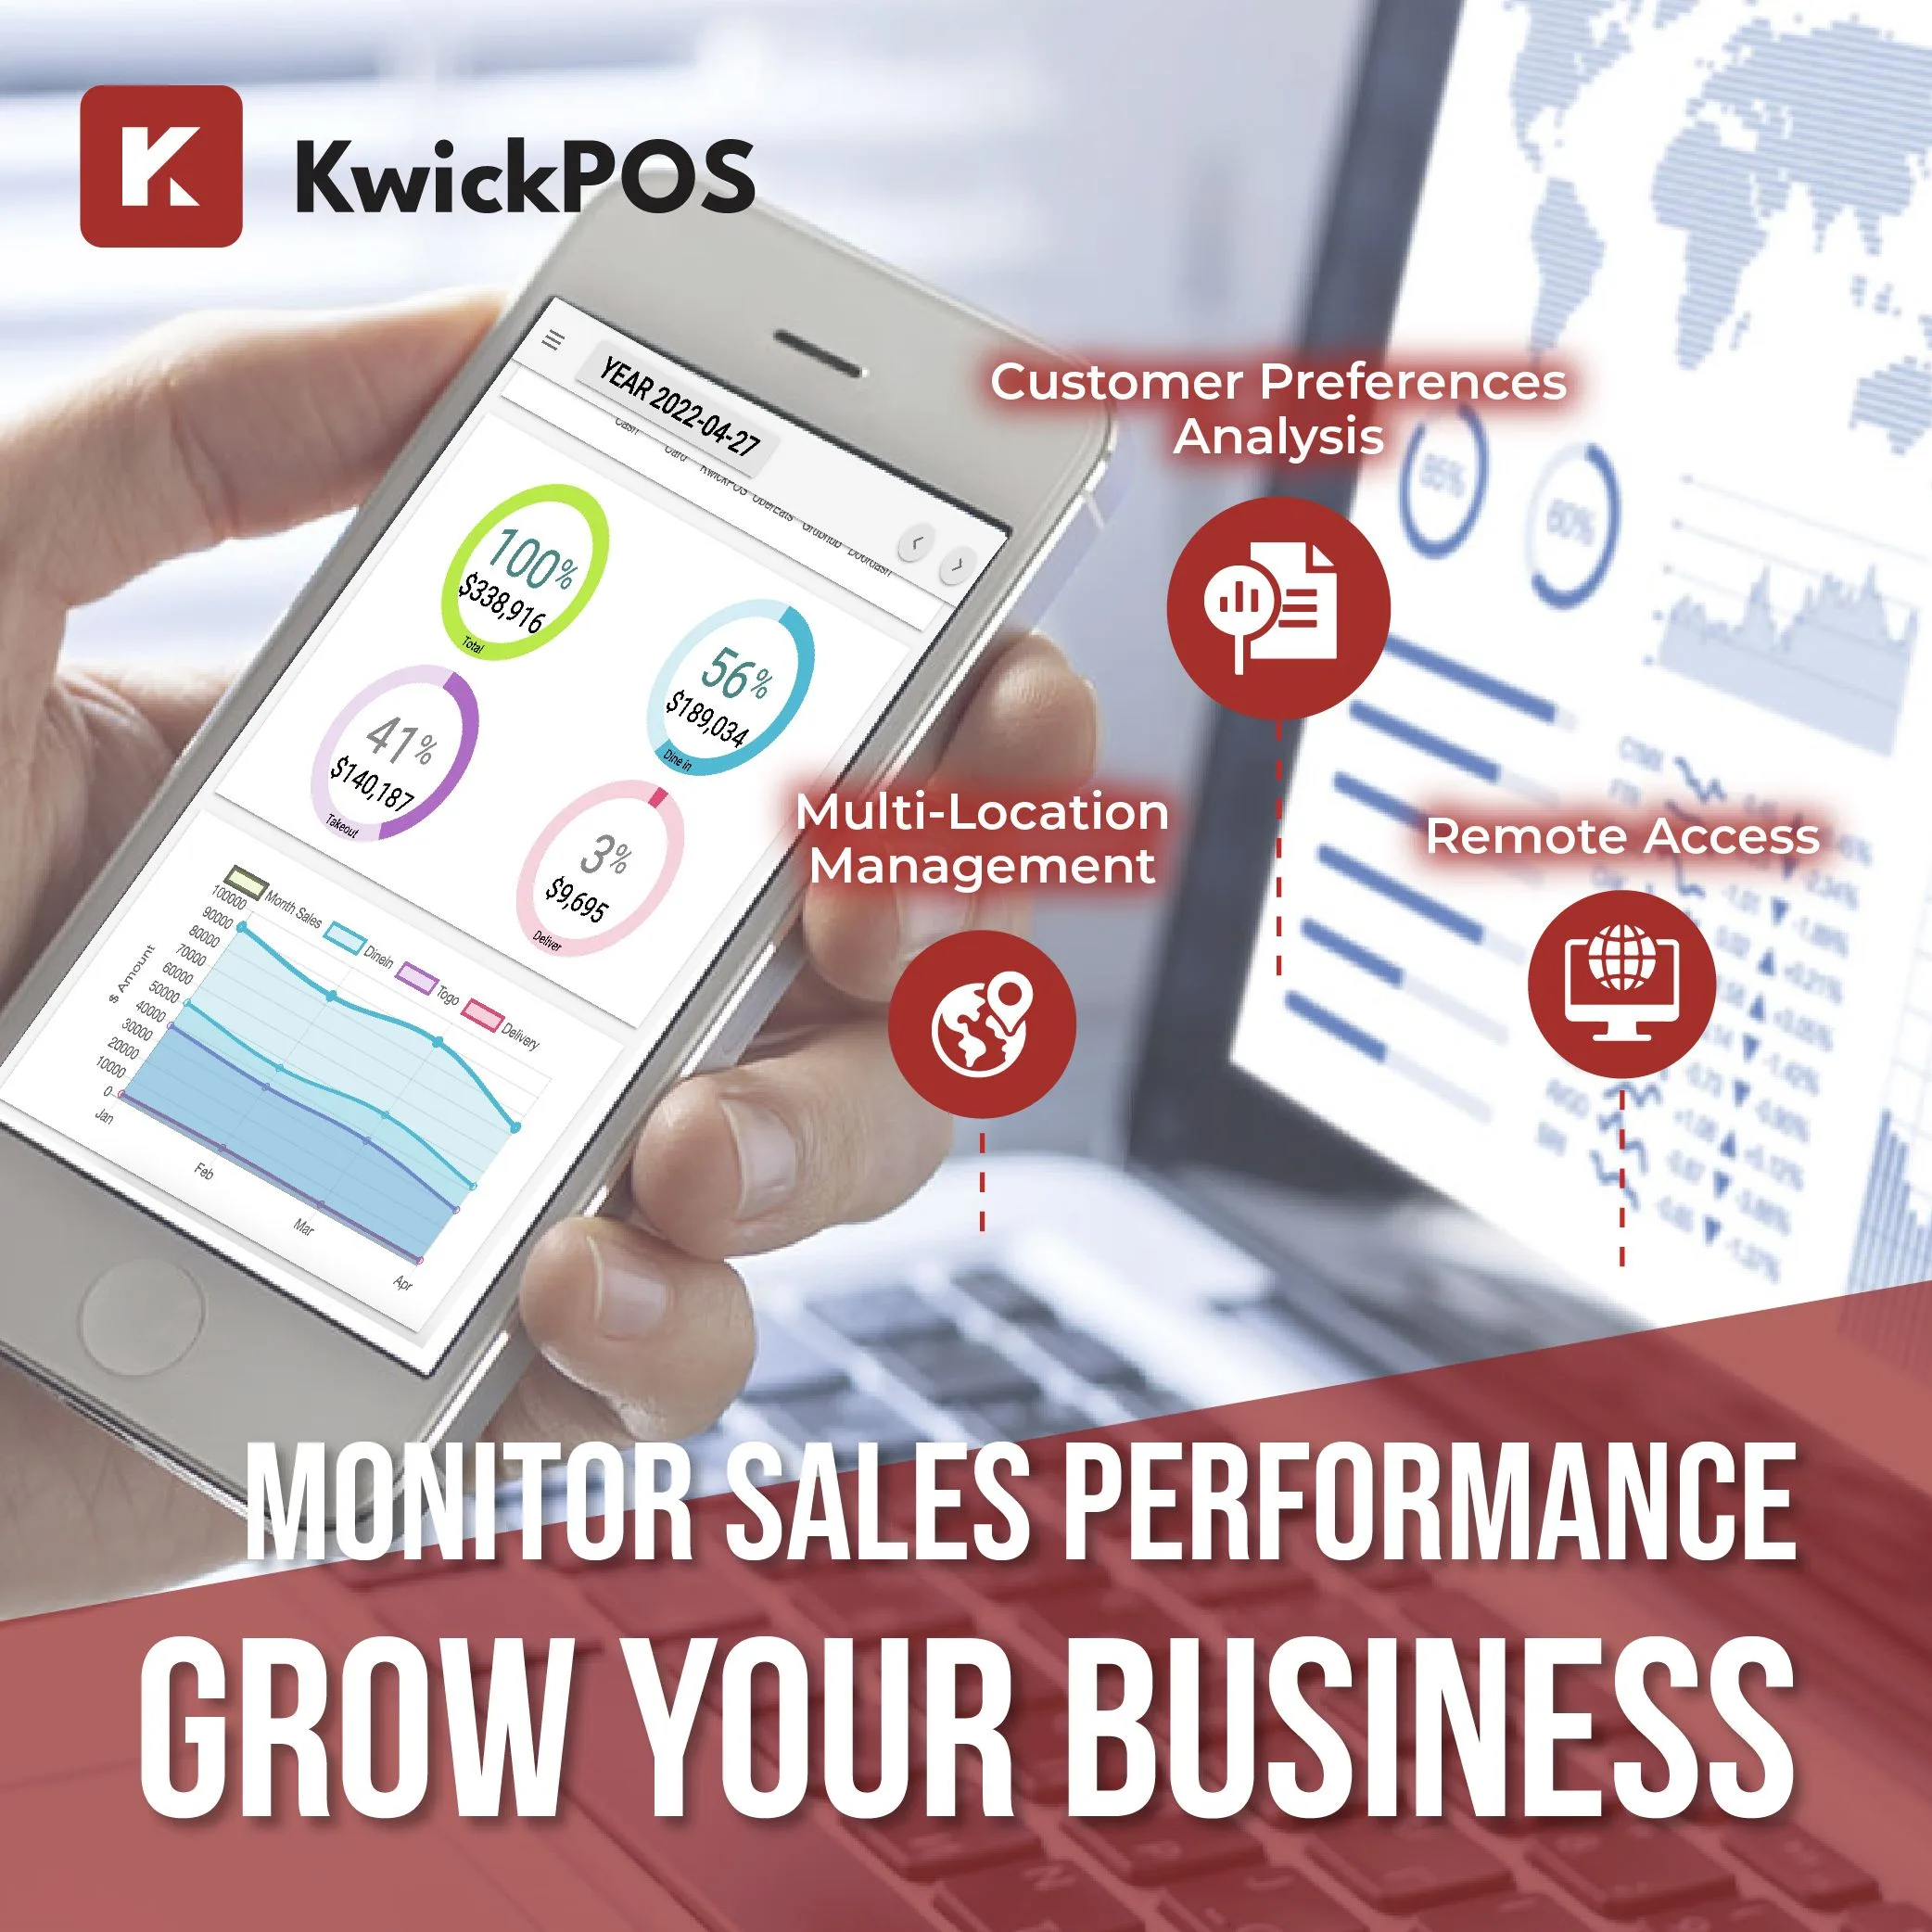
See It In Action
Real dashboards. Real data views. This is what business owners see every day.
Dashboard at a Glance
Daily revenue, top items, labor %, guest count — all on one screen when you open the app. No drilling through menus or waiting for reports to generate.
See today versus yesterday, this week versus last week. Spot trends before they become problems — or opportunities you miss.

Sales Deep-Dive
Hourly, daily, weekly trends. Compare locations. Spot patterns before they become problems. Know which menu items drive profit and which ones drain it.
Filter by server, terminal, payment type, daypart. Export to CSV for your accountant or schedule automatic email delivery every Monday morning.
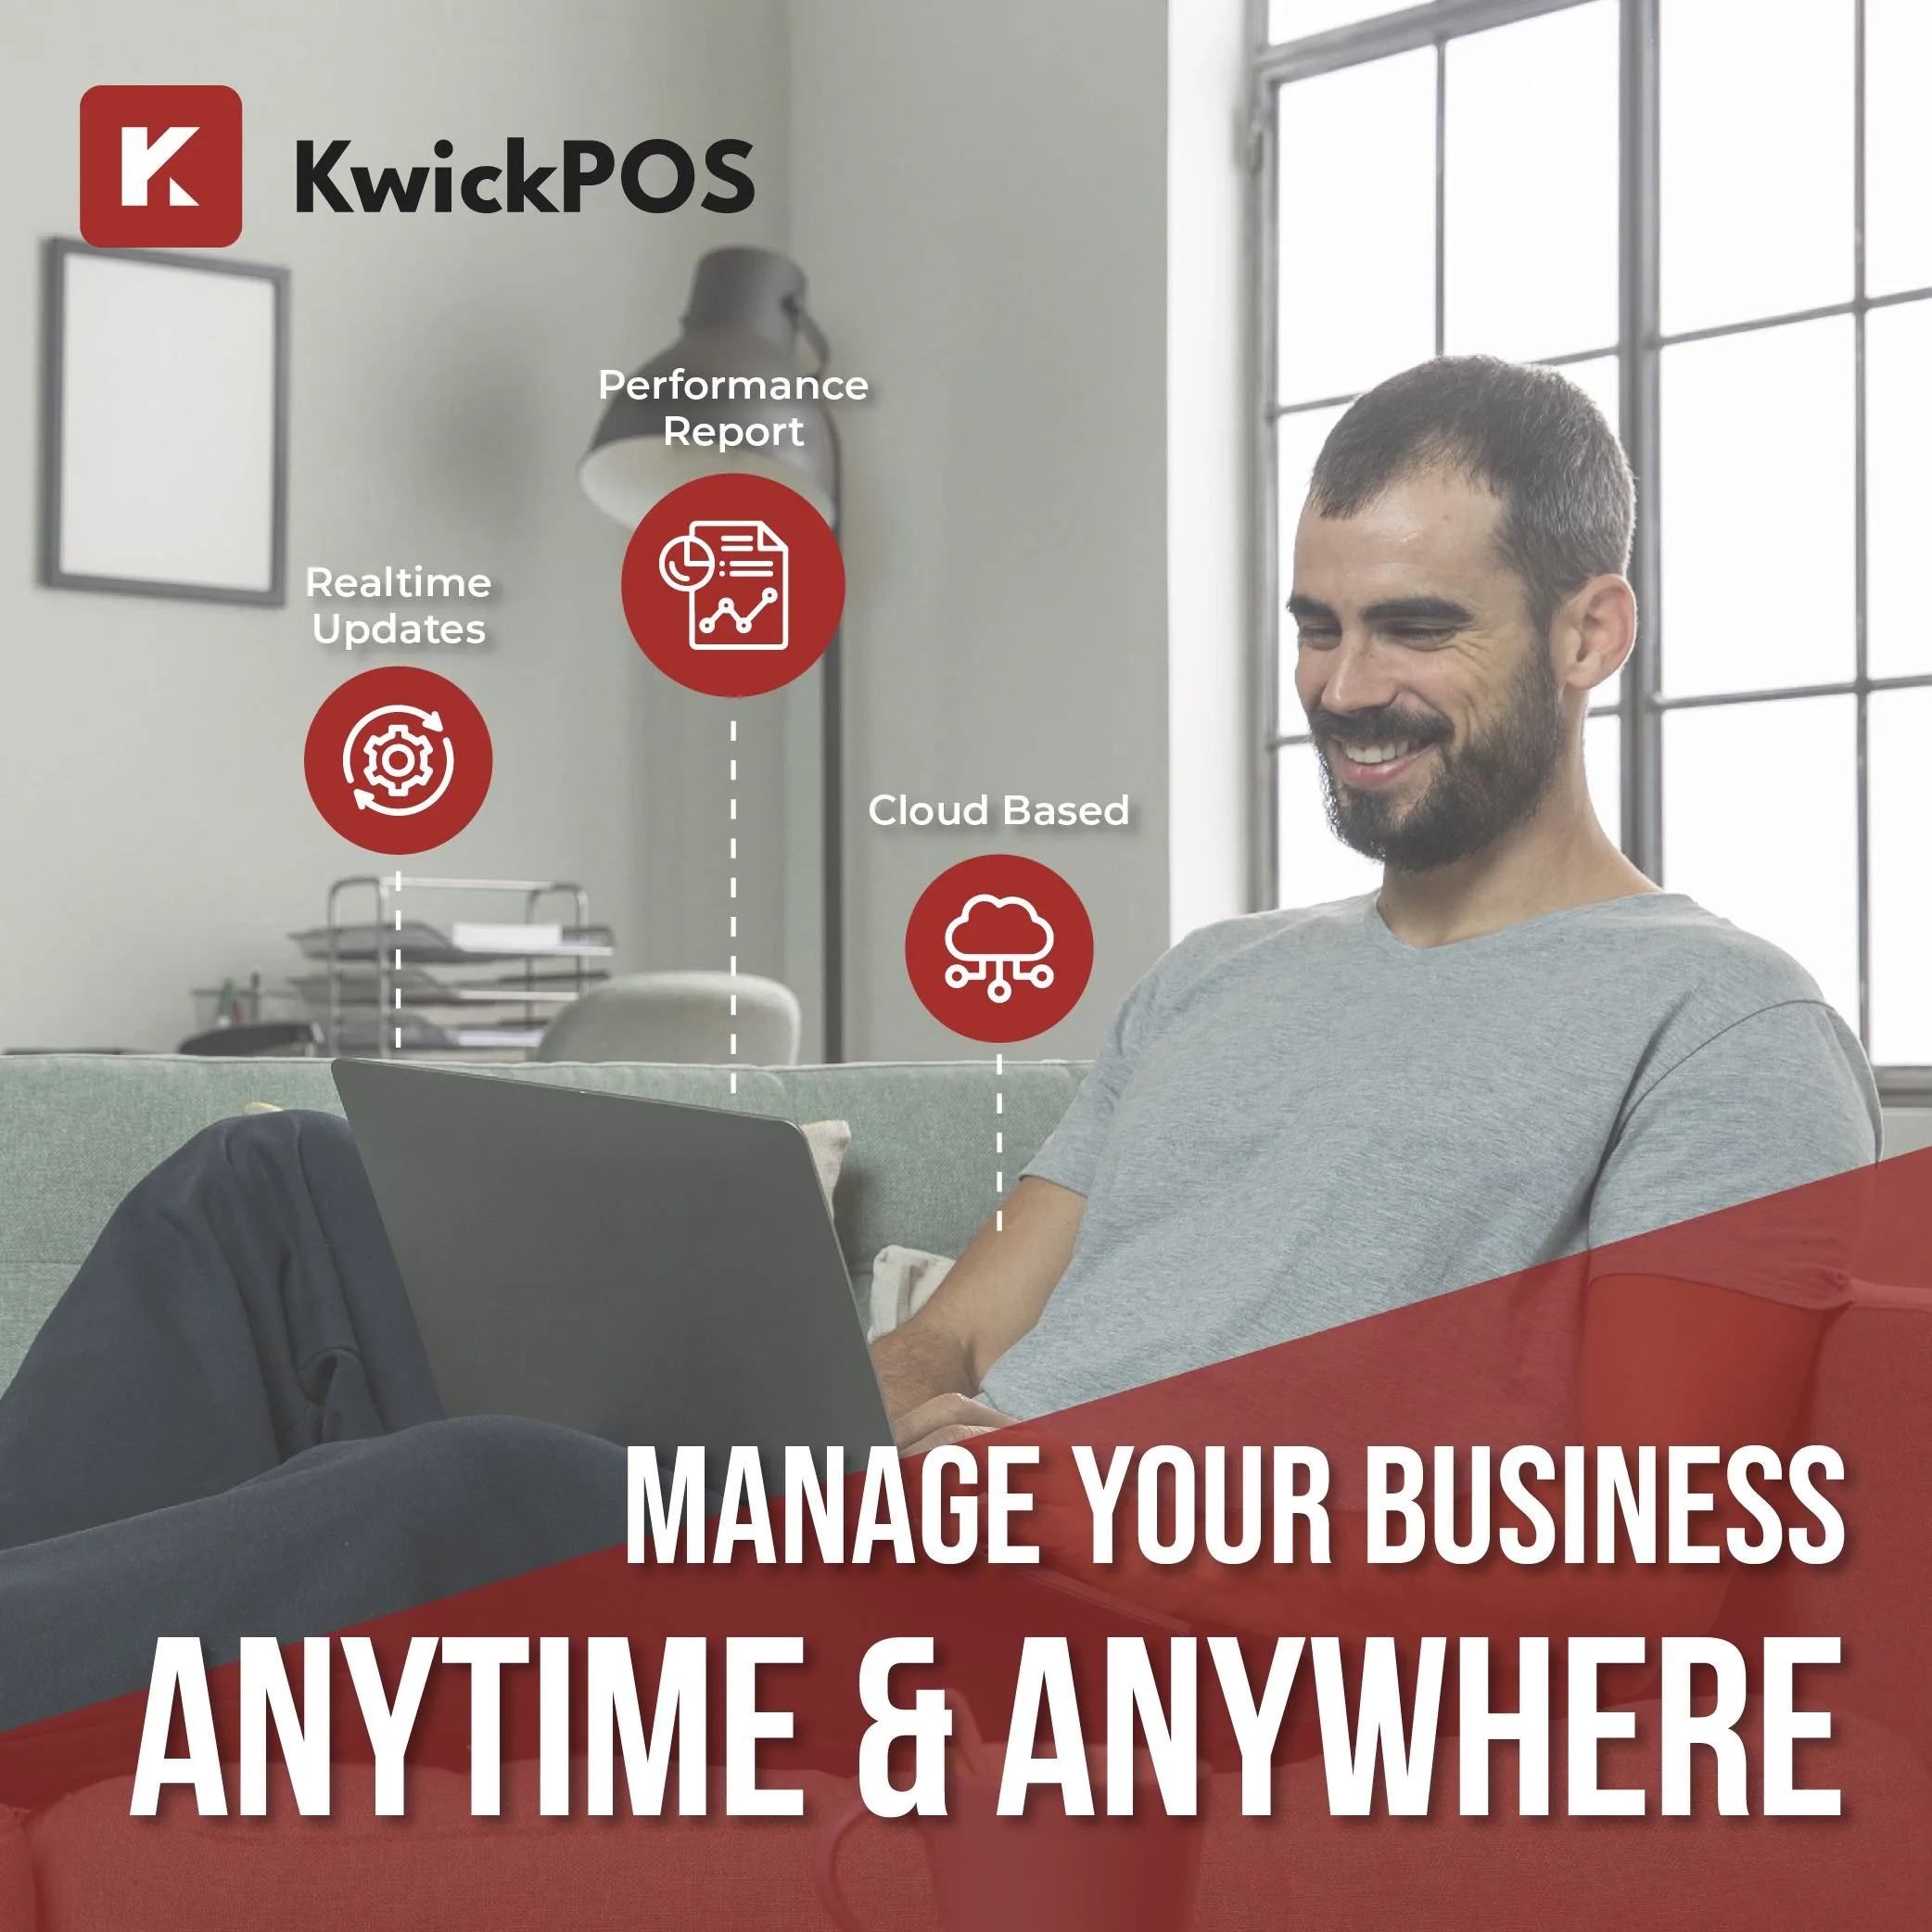
Manage From Anywhere
T. Jin China Diner monitors 15 stores with 75 terminals from a single dashboard. Real-time, remote, no driving between locations.
Get instant alerts for unusual activity — voided transactions, overtime approaching, sales dipping below threshold. Act on data, not gut feelings.
Core Capabilities
Real-Time Dashboard
Live revenue, guest count, labor %, top items — all updating in real time. One screen tells you everything.
P&L Reports
Profit and loss broken down by day, week, month, or custom range. Track food cost, labor cost, and net margins automatically.
Sales Analytics
Hourly heat maps, category breakdowns, server performance. Compare locations and time periods side by side.
Labor Cost Tracking
Real-time labor as a percentage of revenue. Overtime alerts. Shift-by-shift efficiency. Know if you're over-staffed or under-staffed right now.
Inventory Reports
Stock levels, usage patterns, waste tracking, shrinkage alerts. Identify your most profitable items and biggest cost drains.
Remote Multi-Location Access
Monitor every store from one login. Compare performance across locations. No VPN needed — web-based, works on any device.
Real Results From Real Businesses
T. Jin China Diner — 75 Terminals
Real-time remote monitoring across 15 locations from a single dashboard. No driving between stores. Instant visibility into revenue, labor, and operations at every location — all day, every day.
Crafty Crab Seafood — One Dashboard
The operations team manages all 19 stores and 152 terminals from a single reporting dashboard. Menu sync, sales comparison, and labor tracking — all centralized. No spreadsheets, no manual data entry.
Frequently Asked Questions
Ready to See Your Business Clearly?
Join 5,000+ businesses using KwickOS analytics. Free demo, no contracts, no pressure.
Get a Free Demo