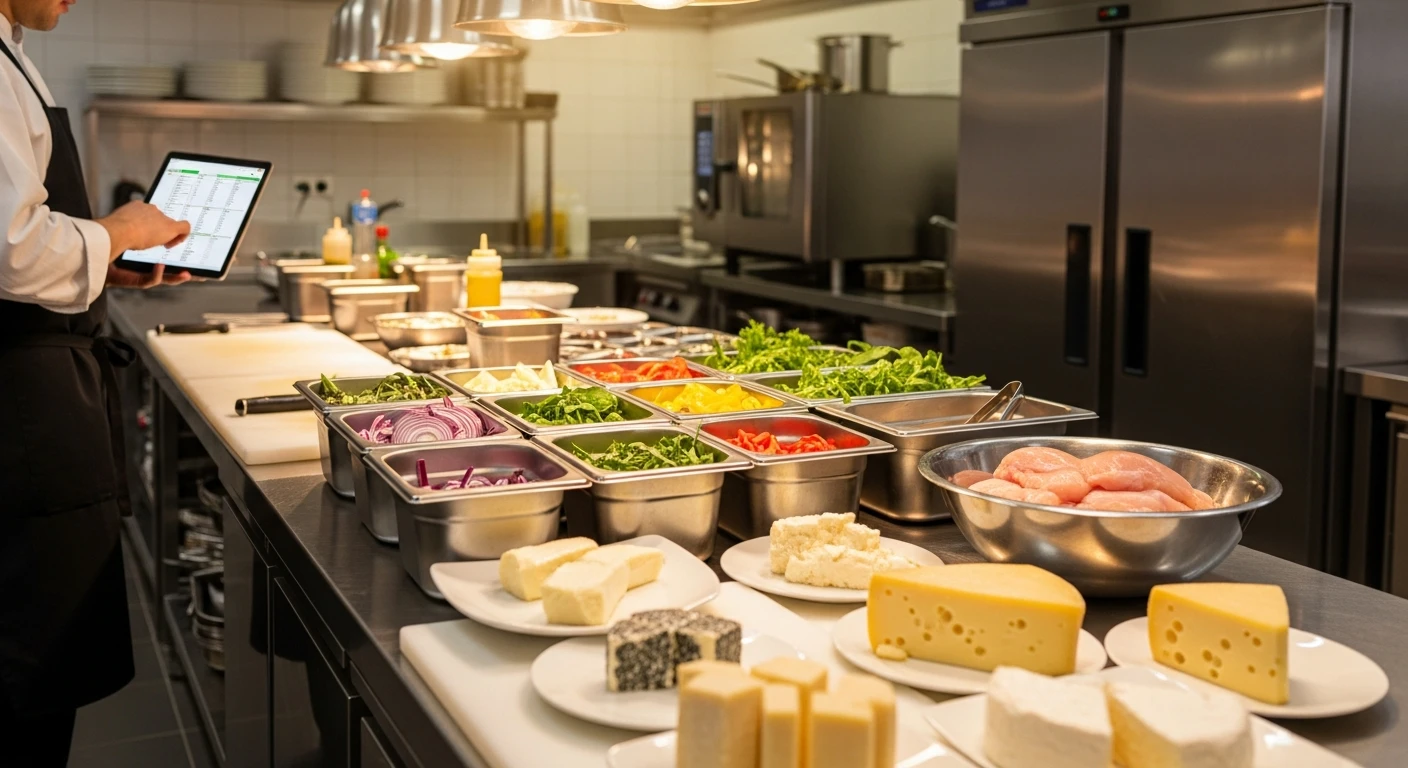
Your walk-in cooler is bleeding money right now. Open it. Count the items that will expire before you use them. Check the back corner where that case of avocados has been sitting since Tuesday's delivery. Add it up — that's cash in the dumpster.
And it's happening every single week. The National Restaurant Association estimates that restaurants generate 25,000 to 75,000 pounds of food waste per year, costing between $15,000 and $25,000 in pure product loss. But food waste is just the visible symptom. The real disease is a lack of inventory visibility — not knowing what you have, what you need, what you're using, and what's walking out the back door.
Here's the thing: your food cost percentage is the single most important number in your restaurant's P&L after labor. The target is 28-32% of revenue. Every percentage point above that range costs a restaurant doing $80,000/month in sales approximately $9,600 per year. Two points over? That's $19,200 — a used car. Three points? That's $28,800 — a kitchen renovation you can't afford.
The good news? Every one of these leaks is fixable. This guide covers 10 specific, actionable inventory management practices — not generic advice like "track your inventory" — that restaurants use to get food cost under control and keep it there.
First: Know Your Numbers
Before you can fix inventory problems, you need to establish your baseline. Here are the four numbers every restaurant owner should know by heart:
| Metric | Formula | Target Range |
|---|---|---|
| Food cost percentage | (Cost of Goods Sold / Food Revenue) x 100 | 28-32% |
| Inventory turnover ratio | COGS / Average Inventory Value | 4-8x per month |
| Waste percentage | (Waste Value / Total Purchases) x 100 | Below 4% |
| Variance (theoretical vs. actual) | Actual usage - Theoretical usage | Below 2% |
Don't know these numbers? That's the first problem to fix. Use our food cost calculator to establish your baseline before reading further.
Tip #1: Count Inventory Weekly, Not Monthly
Monthly inventory counts are like checking your bank account once a month — by the time you spot a problem, weeks of damage have already been done.
Weekly counts take 1-2 hours for a typical restaurant — roughly $30 to $50 in labor cost. That's a small time investment to catch a $500/week over-ordering pattern before it becomes a $2,000/month problem. Focus your weekly counts on high-cost, high-velocity items: proteins, dairy, produce, and alcohol. Low-velocity dry goods can stay on a monthly cycle.
Here's the thing: consistency matters more than thoroughness. A focused weekly count of your top 30 items (which typically represent 70-80% of your food cost) is more valuable than a comprehensive monthly count of 300 items.
Tip #2: Implement FIFO Religiously
FIFO — First In, First Out — is the most basic inventory practice in food service, and the most frequently ignored. The principle is simple: use the oldest product first. Place new deliveries behind existing stock. Date-label everything.
And that's not all: FIFO isn't just about reducing spoilage. It's about food safety. The FDA's food code requires that food be used within established timeframes, and FIFO is the primary method for ensuring compliance.
Restaurants that implement FIFO consistently see spoilage rates drop by 20-30%. For a restaurant losing $20,000/year to waste, that's $4,000 to $6,000 back in your pocket from a practice that costs nothing to implement.
The practical challenge: FIFO breaks down during busy prep periods when cooks grab whatever is closest rather than reaching behind for older product. The fix is organization — dedicated label systems, clear shelf layout, and a prep-line rotation check at the start of each shift.
Tip #3: Set Par Levels for Every Item
Par levels are the minimum quantity of each item you should have on hand at any time. When inventory drops below par, it's time to order. When it's above par, you're tying up cash in excess inventory that may spoil before use.
The formula:
Par Level = (Average Daily Usage x Lead Time in Days) + Safety Stock
Example for chicken breast:
| Variable | Value |
|---|---|
| Average daily usage | 15 lbs |
| Supplier lead time | 2 days |
| Safety stock (1 day) | 15 lbs |
| Par level | 45 lbs |
But it gets worse: static par levels don't account for demand fluctuations. Your chicken usage on a Tuesday is not the same as on a Saturday. Sophisticated inventory systems adjust par levels dynamically based on historical sales patterns, day of week, and even weather forecasts.
Tip #4: Track Theoretical vs. Actual Usage (The Silent Killer)
This is the tip most restaurants skip entirely — and it's the one that costs them the most money.
Theoretical usage is what you should have used based on what you sold. If you sold 50 chicken entrees and each recipe calls for 8 oz of chicken, your theoretical usage is 25 pounds.
Actual usage is what you actually used — measured by comparing beginning inventory plus purchases minus ending inventory.
The gap between theoretical and actual is called variance — and it reveals everything: over-portioning, waste, theft, unrecorded comps, and training problems.
| Variance % | What It Means | Typical Cause |
|---|---|---|
| 0-2% | Excellent — normal operational variance | Minor prep waste, measurement rounding |
| 2-5% | Acceptable but investigate | Over-portioning, unrecorded waste |
| 5-10% | Significant — action required | Systematic over-portioning, unrecorded comps/voids |
| 10%+ | Critical — likely theft or major process failure | Employee theft, receiving errors, vendor shortages |
Here's the thing: you can't calculate variance without a POS system that tracks recipe-level ingredient deductions. When a server rings in a chicken Caesar salad, the system needs to automatically deduct 8 oz chicken, 4 oz romaine, 2 oz dressing, 1 oz croutons, and 0.5 oz parmesan from inventory. Without this, theoretical usage is a guess — and guesses don't save money.
Tip #5: Audit Deliveries Every Single Time
A 2023 study by the Food Marketing Institute found that 1 in 4 restaurant deliveries contains errors — wrong quantities, substituted products, or items billed but not delivered. At an average order size of $2,000, that's $500 in potential errors per week if you're not checking.
Delivery auditing takes 10-15 minutes per delivery. Here's the checklist:
- Compare delivered items against the purchase order line by line.
- Weigh proteins and produce — don't trust case counts for items sold by weight.
- Check temperatures: proteins below 40°F, frozen items below 0°F.
- Inspect produce quality — reject items that won't last through their expected use window.
- Note any substitutions or shorts on the delivery receipt before signing.
Over a year, diligent delivery auditing recovers $3,000 to $8,000 in vendor errors that would otherwise become invisible food cost increases.
Tip #6: Use Your POS Data to Forecast Demand
Your POS system contains years of sales data broken down by item, day, time, and season. This data should drive your purchasing decisions — not your chef's intuition.
And that's not all: demand forecasting doesn't just reduce waste from over-ordering. It also prevents stockouts that force 86'd items and lost sales. A customer who orders the salmon and gets told "we're out" doesn't order the chicken instead — they leave a bad review.
Case Study: Crafty Crab Seafood
Crafty Crab Seafood operates 19 stores with 152 terminals on KwickOS. Managing inventory across 19 locations selling perishable seafood is a logistical nightmare without the right systems.
Their solution leverages KwickOS's one-click menu sync across all locations. When a new seasonal item is added or a menu price changes, it propagates to all 19 stores instantly. But more importantly, the centralized system means purchasing decisions are data-driven:
- Each location's sales data feeds into a consolidated demand forecast.
- Par levels adjust automatically by location based on that store's specific sales patterns.
- Variance reports flag any location where actual usage significantly exceeds theoretical — indicating waste or portioning problems at that specific store.
- Bulk purchasing across 19 locations is coordinated centrally, capturing volume discounts that a single location couldn't negotiate.
The result: consistent food cost across all locations, minimal waste on perishable seafood, and the operational efficiency that comes from a single system managing inventory for 152 terminals.
Tip #7: Standardize Recipes and Portions
If your cooks are eyeballing portions, your food cost is a random number. A cook who "generously" adds an extra ounce of protein to every plate is costing you $1.50 to $3.00 per plate — or $15,000 to $30,000 per year at 30-50 entrees per shift.

Every menu item needs a recipe card with exact quantities, measured in weights rather than volumes where possible. Invest in portioning tools: scales, ladles with marked capacities, portion-controlled scoops, and pre-portioned containers for high-cost items.
But it gets worse: inconsistent portioning doesn't just inflate food cost. It creates inconsistent customer experiences. The regular who loves your generous portions on Tuesday is disappointed by the normal portion on Thursday — or vice versa. Standardization serves both your bottom line and your customers.
Tip #8: Negotiate Vendor Contracts Quarterly
Most restaurants set up vendor relationships once and never revisit them. Meanwhile, commodity prices fluctuate weekly, new suppliers enter the market, and your volume may have changed significantly since you last negotiated.
Here's the thing: vendor loyalty is costing you money. A study by Restaurant Business Magazine found that restaurants that bid out their purchasing quarterly save 8-12% on food costs compared to those who stick with a single vendor.
That doesn't mean you need to switch vendors constantly. It means you need to know what the market rate is. Get competing quotes quarterly. Present them to your current vendor. Ask them to match. If they can't, evaluate whether the service difference justifies the price difference.
Use our unit price calculator to normalize vendor pricing across different package sizes and compare true per-unit costs.
Tip #9: Implement a Waste Log
If you're not tracking waste, you can't reduce it. A waste log captures every item discarded, the quantity, the reason (spoilage, over-prep, customer return, dropped), and the estimated cost.
Within two weeks of implementing a waste log, most restaurants discover patterns they had no idea existed:
- A specific prep cook consistently over-preps mise en place by 30%.
- A particular produce item spoils before use every week because it's ordered in quantities that exceed demand.
- The Sunday brunch buffet generates $400 in waste every week because the replenishment threshold is set too high.
- Customer returns on a specific dish indicate a recipe or quality problem, not just customer preference.
Now here's where it gets interesting: the waste log turns invisible losses into visible, actionable data. It's the difference between "food cost is high" and "we're losing $180/week on over-prepped salmon because Tuesday dinner volume dropped 20% last month."
Want to know exactly when your waste reductions will pay off? Run the numbers with our break-even calculator to see how quickly inventory improvements hit your bottom line.
Tip #10: Integrate Inventory With Your POS (Stop Using Spreadsheets)
Spreadsheet-based inventory management has a fatal flaw: it's disconnected from your sales data. You're manually entering counts, manually calculating usage, manually comparing against purchase orders. Every manual step is an error opportunity, and the data is always stale by the time you act on it.
An integrated POS-inventory system does this in real time:
| Function | Spreadsheet Approach | Integrated POS |
|---|---|---|
| Ingredient deduction per sale | Not possible | Automatic, recipe-level |
| Par level alerts | Manual check during counts | Real-time push notifications |
| Theoretical vs. actual variance | Weekly at best (manual calc) | Daily, per-item, per-location |
| Food cost percentage | Known 2-4 weeks after month-end | Real-time, updated with every sale |
| Vendor price comparison | Manual spreadsheet | Automatic price history tracking |
| Multi-location consolidation | Hours of manual work | One dashboard, all locations |
This is why Crafty Crab can manage inventory across 19 locations without a dedicated inventory team at each store. The system does the math. The managers make decisions. If you're still on a legacy POS without built-in inventory, see how KwickOS compares to Toast and KwickOS vs Square on inventory features.
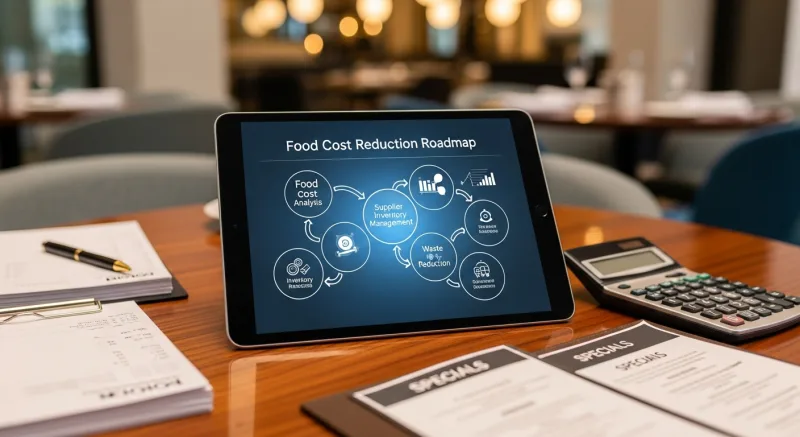
The Food Cost Reduction Roadmap
You can't implement all 10 tips simultaneously. Here's a prioritized rollout that delivers the fastest ROI:
| Week | Action | Expected Impact |
|---|---|---|
| Week 1 | Calculate baseline food cost %, start waste log | Visibility (no savings yet) |
| Week 2 | Implement FIFO, audit next 4 deliveries | 0.5-1% food cost reduction |
| Week 3-4 | Set par levels for top 30 items, standardize portions for top 10 entrees | 1-2% food cost reduction |
| Month 2 | Switch to weekly counts, get competing vendor quotes | 0.5-1% additional reduction |
| Month 3 | Integrate inventory with POS, begin tracking variance | 1-2% additional reduction |
A restaurant doing $80,000/month that reduces food cost by 3 percentage points saves $28,800 per year. That's not a theoretical number — it's the documented result of implementing the practices in this guide.
The Bottom Line
Inventory management isn't glamorous. It's not the part of the restaurant business that anyone gets excited about. But it's the part that determines whether you're profitable.
The gap between a well-managed restaurant at 28% food cost and a poorly-managed restaurant at 35% food cost is $67,200 per year on $80K/month in revenue. That's larger than most restaurant owners' personal income.
You don't need to be perfect. You need to be systematic. Count weekly. Track waste. Audit deliveries. Standardize portions. And most importantly, use a system that connects your sales data to your inventory data so you can see problems in real time — not weeks after the money is already gone.
See Your Food Cost in Real Time
KwickOS integrates POS, inventory, and recipe management in one platform. Track food cost per item, per shift, per location — and get alerts before waste becomes a problem.
Get a Demo