There is a number that most restaurant owners would rather not think about. The USDA estimates that restaurants generate between 22 and 33 billion pounds of food waste annually in the United States. Broken down to the individual level, the average full-service restaurant throws away approximately 25,000 to 75,000 pounds of food each year. At an average food cost of $1.00 to $1.50 per pound, that translates to $25,000 to $112,500 in wasted product alone — before you factor in the labor that went into prepping it, the energy that went into storing and cooking it, and the disposal costs for hauling it away.
The restaurant industry operates on razor-thin margins. The typical full-service restaurant earns a net profit margin between 3% and 9%. A restaurant doing $1 million in annual revenue and netting 6% takes home $60,000. If that same restaurant can reduce its food waste by even 30%, it saves roughly $7,500 to $33,750 per year — a sum that goes straight to the bottom line with zero additional revenue required.
This is not an article about guilt or sustainability marketing, although both have their place. This is an article about money. Specifically, the money you are currently putting into dumpsters, and the concrete steps you can take to stop.
According to the USDA and the Restaurant Association, the typical independent restaurant wastes 4% to 10% of purchased food before it ever reaches a customer's plate. For a restaurant with $400,000 in annual food purchases, that is $16,000 to $40,000 thrown away.
1. Conduct a Waste Audit First
You cannot reduce what you do not measure. Before implementing any waste-reduction strategy, you need to understand where your waste is coming from. Most restaurant operators are surprised by the results.
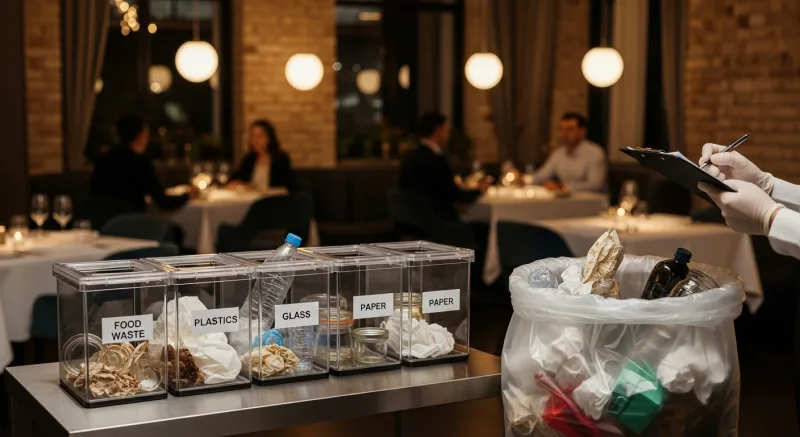
A waste audit does not require hiring a consultant. It requires a scale, a few buckets, and one week of discipline. Set up labeled bins in your kitchen: overproduction, spoilage, plate waste, and trim/prep waste. Have your kitchen staff sort discards into the appropriate bin throughout each service. Weigh the bins at the end of every shift.
After one week, you will have a clear picture of your waste profile. In most restaurants, the breakdown looks roughly like this:
| Waste Category | Typical Share | Primary Cause |
|---|---|---|
| Overproduction | 30-40% | Preparing too much food for anticipated demand |
| Spoilage | 20-25% | Ingredients expiring before use |
| Plate waste | 15-25% | Portions too large, sides customers did not want |
| Prep/trim waste | 15-20% | Peels, stems, bones, excess trim |
Each category requires a different solution. Overproduction is a forecasting problem. Spoilage is an inventory management problem. Plate waste is a menu design and portion control problem. Trim waste is a utilization and creativity problem. Treating food waste as a single issue is why most waste-reduction efforts fail. You need targeted interventions for each category.
2. Implement FIFO Religious — Not Just in Theory
First In, First Out is the oldest rule in food storage, and the most commonly violated. Nearly every restaurant claims to follow FIFO. Very few actually do it consistently. The gap between FIFO policy and FIFO practice is where spoilage lives.
The problem is almost always structural, not attitudinal. Kitchen staff know they should rotate stock. But when a delivery arrives during a busy prep period, the fastest thing to do is stack the new cases on top of the old ones and get back to the cutting board. Three days later, the older product on the bottom has expired.
True FIFO requires three things:
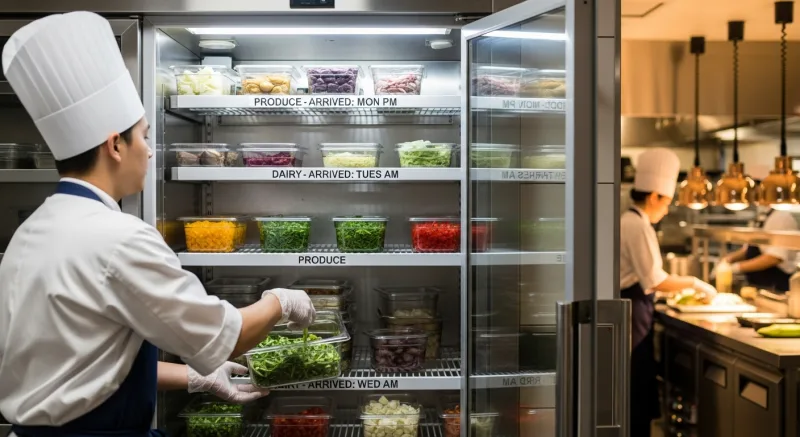
- Date labeling on every item that enters storage. Not the delivery date — the use-by date. Use day-dot labels or write the date directly on the packaging. Every single container, every single time.
- Storage organization that makes rotation effortless. Shelving should be arranged so that older product is always at the front and always on top. When new deliveries arrive, the standing rule is: pull everything forward, stock new product in the back. No exceptions.
- Daily walk-through of all storage areas. A manager should spend five minutes every morning walking through the walk-in, the dry storage, and the reach-in coolers. Check dates. Pull anything that is within one day of expiration to a "use first" shelf. Flag items that need to be incorporated into today's specials or prepped immediately.
Restaurants that enforce FIFO rigorously — not as a suggestion but as a non-negotiable standard — typically reduce spoilage waste by 30% to 50%. On a $400,000 food budget where spoilage represents $8,000 to $10,000 per year, that is $2,400 to $5,000 saved.
3. Right-Size Your Pars with Demand Forecasting
Overproduction is the single largest category of restaurant food waste, and it stems from a fundamental challenge: you have to prep food before you know how many customers will walk through the door. Every kitchen runs on pars — the predetermined quantities of prepped items that should be ready before each service. Set your pars too low and you run out. Set them too high and you throw food away.
Most kitchens set pars based on intuition and experience. A good chef develops a feel for how much chicken to prep on a Thursday versus a Saturday. But intuition cannot account for weather changes, local events, seasonal patterns, or the gradual shifts in menu mix that happen over months.
Data-driven par setting uses your POS sales data to forecast demand with much greater precision. Here is how it works:
- Pull item-level sales data for the past 8 to 12 weeks from your POS system, broken down by day of week.
- Calculate the average and standard deviation for each item on each day of the week. If your grilled salmon averages 28 orders on Fridays with a standard deviation of 5, your par should be 33 (average plus one standard deviation). This gives you a 84% confidence level of not running out.
- Adjust for known variables. A reservation book showing 40 more covers than usual Friday? Increase pars proportionally. Severe weather forecast? Reduce by 15-20%.
- Review and adjust weekly. As menu items gain or lose popularity, your pars should shift with them.
A POS system with robust reporting — one that lets you pull item-level sales by day, by daypart, by weather, and by season — is the foundation of accurate demand forecasting. KwickOS provides this granularity through its built-in Reports & Finance module, allowing operators to analyze sales patterns down to the individual menu item level.
Restaurants that move from intuition-based to data-driven prep quantities consistently report significant waste reductions — and fewer 86'd items during service.
4. Engineer Your Menu for Ingredient Overlap
Menu engineering is usually discussed in terms of profitability and popularity — the classic "stars, puzzles, plowhorses, and dogs" matrix. But there is a waste dimension to menu engineering that rarely gets the attention it deserves: ingredient overlap.
Every unique ingredient on your menu is a potential waste source. If only one dish uses fresh tarragon, and that dish sells eight times per week, you are buying tarragon that sits in the walk-in slowly deteriorating between orders. Multiply this across 15 or 20 low-overlap ingredients and the spoilage adds up fast.
The goal is to design a menu where each ingredient appears in multiple dishes. This accelerates turnover, reduces the variety of items in inventory, and ensures that everything in your walk-in is moving. A restaurant with 40 menu items built from 60 core ingredients will waste far less than one with 40 items built from 120 ingredients.
Practical steps for reducing ingredient waste through menu design:
- Map every ingredient to every dish it appears in. Create a spreadsheet. If an ingredient appears in only one dish and that dish sells fewer than 15 times per week, either add it to another dish or consider removing it from the menu.
- Design daily specials around excess inventory. Rather than planning specials a week in advance, let your specials be driven by what needs to be used. This requires a chef who can improvise — and a POS system that lets you add specials quickly.
- Use the same protein in multiple preparations. A whole chicken yields breasts, thighs, wings, and bones for stock. A whole fish yields filets, collar for grilling, and frames for fumet. Whole-animal utilization is not just a sustainability statement — it is waste elimination.
Multi-location operators like Crafty Crab Seafood, which runs 19 stores on KwickOS, use centralized menu management to push menu changes across all locations simultaneously. When a menu is engineered for ingredient overlap at the corporate level, the waste reduction multiplies across every store.
5. Control Portions with Precision
Plate waste — the food that customers leave behind — represents 15% to 25% of total restaurant food waste. And the number one driver of plate waste is portions that are too large.
There is a deeply ingrained belief in the American restaurant industry that bigger portions equal better value. This belief is costing the industry billions. Customers do not eat the extra two ounces of pasta. They push it around the plate and it goes in the bin. You paid for those two ounces. You prepped them. You cooked them. And you threw them away.
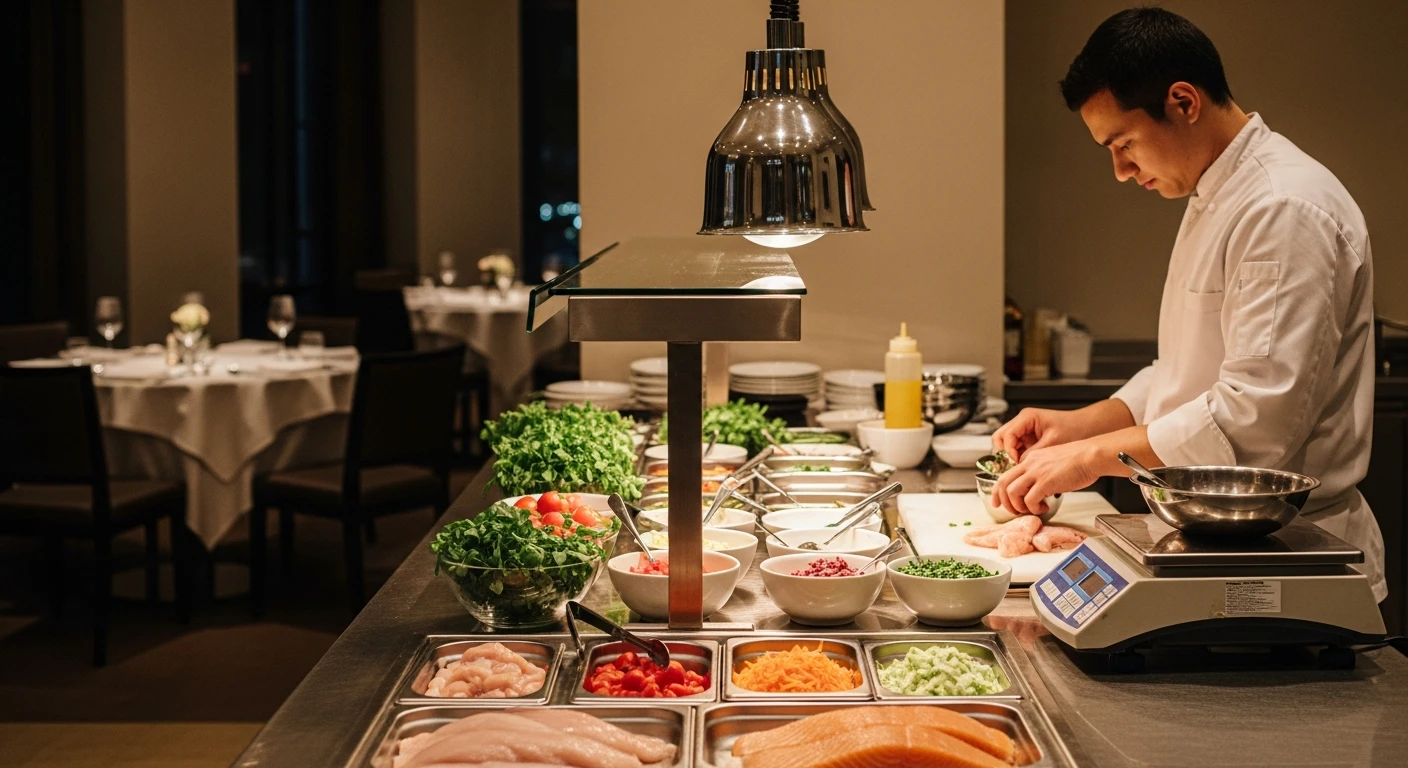
Portion control starts with standardized recipes that specify exact weights for every component of every dish. Not "a scoop of mashed potatoes" — "six ounces of mashed potatoes, served with a #8 disher." Every station in your kitchen should have the appropriate portioning tools: scales, dishers, ladles with known volumes, and portion-marked containers.
The financial impact is significant. If your average entree uses one ounce more protein than the recipe specifies, and you serve 200 entrees per day at an average protein cost of $0.50 per ounce, you are losing $100 per day — $36,500 per year. That is not food waste in the traditional sense, because it reaches the customer's plate. But it is cost waste, and it is entirely preventable.
Consider these portion-control strategies:
- Offer two portion sizes where appropriate. A "regular" and "hearty" option for pasta, rice bowls, or salads lets customers self-select. Many will choose the smaller portion, and your waste drops.
- Serve sides separately or offer a choice. Not every customer wants the fries. Let them pick a side or opt out entirely.
- Train every cook on exact portioning. Run periodic spot-checks with a scale. If a cook is consistently over-portioning, they need retraining, not punishment.
6. Optimize Inventory Ordering with Technology
Over-ordering is the upstream cause of spoilage. If you order 50 pounds of lettuce and only use 35, those remaining 15 pounds have a clock ticking from the moment they enter your walk-in. The solution is not to order less across the board — it is to order more precisely.
Modern inventory management systems connect your POS sales data directly to your ordering workflow. When your system knows you sold 142 Caesar salads last week and each salad uses 3 ounces of romaine, it can calculate that you need approximately 27 pounds of romaine for the coming week. Add a 10% buffer for waste and walk-ins, and your order is 30 pounds — not the 50 pounds your produce supplier would love to sell you.
Key inventory practices that reduce waste:
- Count inventory at least weekly. Many restaurants count monthly, which means six weeks can pass between a spoilage problem starting and anyone noticing it.
- Track usage rates, not just stock levels. Knowing you have 20 pounds of shrimp means nothing without knowing you use 25 pounds per week. Usage-rate tracking reveals slow-moving items before they expire.
- Set reorder points based on lead time and usage. If your seafood delivery takes two days and you use 5 pounds of salmon per day, your reorder point is 10 pounds. Ordering before you hit that point prevents both stockouts and overstocking.
- Negotiate flexible delivery schedules. Receiving produce three times per week instead of once means ordering smaller quantities with less time to spoil. The delivery cost may be slightly higher, but the waste savings more than offset it.
Use our food cost calculator to understand exactly what your current food cost percentage is and where waste is eroding your margins.
7. Train Your Staff — And Make It Stick
Every waste-reduction strategy in this article requires your staff to execute it. And staff execution requires training that goes beyond a single orientation session. The restaurants that successfully reduce food waste treat it as an ongoing operational priority, not a one-time initiative.
Effective food waste training covers three areas:
- The financial reality. Show your team the numbers. When a line cook knows that the restaurant throws away $500 worth of food per week and that reducing it by $100 per week means the restaurant can afford to give everyone a raise, waste reduction becomes personal.
- The specific behaviors. Do not tell staff to "waste less." Tell them exactly what to do. Date-label every container. Use a scale for portioning. Pull older product forward during every shift. Run the daily waste sort. These are concrete, observable actions.
- The feedback loop. Post weekly waste numbers where staff can see them. Track progress. Celebrate improvements. When the team sees the number going down, the behavior reinforces itself.
Some KwickOS operators use staff scheduling tools to build waste-audit tasks into specific shifts — assigning a team member to weigh and log waste bins as part of their closing checklist. When waste tracking is built into the workflow rather than added on top of it, compliance improves dramatically.
8. Repurpose Trim and Scraps Creatively
Not all food waste is truly waste. A significant portion of what restaurants discard is perfectly edible material that simply does not fit the original recipe: vegetable trim, herb stems, meat bones, bread ends, overripe fruit, and cooking liquids.
The best kitchens treat these as ingredients, not garbage:
- Vegetable trim becomes stock. Onion ends, carrot peels, celery leaves, and mushroom stems produce excellent stock at zero ingredient cost. Freeze trim in bags until you have enough for a batch.
- Stale bread becomes croutons, breadcrumbs, or bread pudding. Day-old baguettes are a feature, not a bug, in French onion soup.
- Overripe fruit becomes sauces, jams, or cocktail syrups. Bananas that are too spotted for a fruit plate are perfect for banana bread or smoothies.
- Meat bones and shells make broths and sauces. A shrimp bisque made from shells that would otherwise be thrown away is a high-margin menu item created from zero-cost ingredients.
- Herb stems infuse oils and vinegars. Cilantro stems have more flavor than the leaves. Use them.
This is not about being trendy. It is about extracting maximum value from every dollar of food you purchase. A restaurant that uses 95% of what it buys has a fundamentally different cost structure than one that uses 85%.
9. Manage Your Buffet and Prep Stations Smarter
If your restaurant operates a buffet, salad bar, or any self-serve station, those areas are almost certainly your largest waste generators. The traditional approach — fill the hotel pan, let it sit under the heat lamp for three hours, throw it out at the end of service — is enormously wasteful.
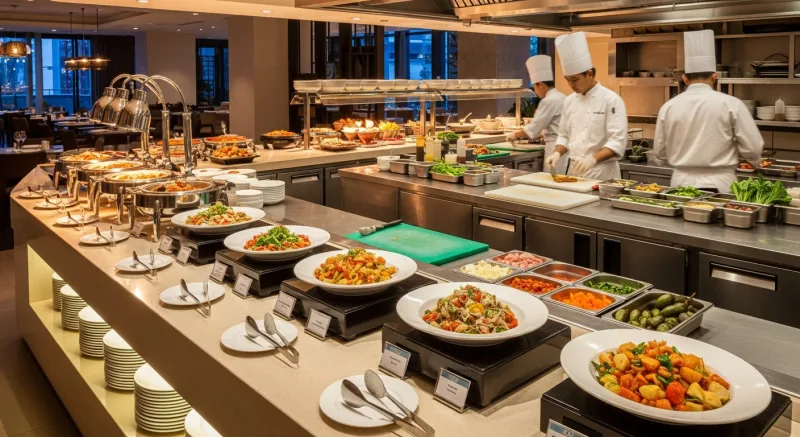
The solution is smaller batches, more frequently replenished. Instead of filling a full hotel pan of mashed potatoes at 11:00 AM, fill it one-third full and replenish every 30 to 45 minutes. The food stays fresher, looks more appealing (which actually increases customer satisfaction), and at the end of service, you have one-third of a pan to dispose of rather than half of a full pan.
This requires slightly more labor attention, but the food savings are substantial. Buffet restaurants that switch from full-batch to small-batch replenishment typically reduce buffet waste by 40% to 60%.
For prep stations, the same principle applies. Do not prep the entire day's supply at 8 AM. Break prep into two sessions — morning and mid-afternoon — so that afternoon and evening service uses freshly prepped ingredients rather than product that has been sitting for eight hours.
10. Track, Measure, and Adjust Continuously
The waste audit you conducted in Step 1 is not a one-time exercise. It is the beginning of an ongoing measurement program. Restaurants that track food waste weekly and review it in management meetings consistently outperform those that audit once and move on.
Here are the key metrics to track:
| Metric | Target | How to Calculate |
|---|---|---|
| Food cost percentage | 28-35% (varies by concept) | Total food purchases / Total food revenue |
| Waste as % of purchases | Under 4% | Value of discarded food / Total food purchases |
| Spoilage rate | Under 2% | Value of expired product / Total food purchases |
| Plate waste per cover | Under 4 oz | Total plate waste weight / Number of covers served |
| Inventory turnover | 4-8x per month for perishables | Monthly food cost / Average inventory value |
Your POS system is the backbone of this tracking. Every menu item sold, every inventory count, every cost calculation flows through it. Operators running on KwickOS use the reporting dashboard to monitor food cost percentage in real time — catching cost spikes within days rather than discovering them at the end of the month when the damage is already done.
T. Jin China Diner, which operates 15 locations with 75 terminals on KwickOS, uses real-time reporting across all stores to identify waste patterns at individual locations. When one store's food cost spikes above the group average, management investigates immediately. That kind of visibility across a multi-location operation is only possible with a unified platform that connects POS data, inventory, and reporting in a single system.
The Compound Effect of Waste Reduction
None of these ten strategies alone will transform your food cost overnight. But implemented together, the effect compounds. A restaurant that reduces overproduction by 30%, cuts spoilage by 40%, decreases plate waste by 20%, and repurposes 50% of its trim does not just save a little money. It fundamentally changes its cost structure.
Let us put numbers on a realistic scenario. A full-service restaurant doing $800,000 in revenue with a 33% food cost ($264,000 in food purchases) and a current waste rate of 8% ($21,120 per year in waste):
| Strategy | Waste Reduction | Annual Savings |
|---|---|---|
| Data-driven par setting | Overproduction down 30% | $2,534 |
| Strict FIFO enforcement | Spoilage down 40% | $1,690 |
| Portion control standardization | Plate waste down 20% | $845 |
| Menu ingredient overlap | Spoilage down additional 15% | $634 |
| Trim repurposing | Trim waste down 50% | $1,690 |
| Inventory ordering optimization | Over-ordering down 25% | $1,320 |
| Total estimated savings | $8,713 |
That is $8,713 per year from a single location with a modest waste rate. A restaurant with a higher waste rate, higher food cost, or multiple locations would see proportionally larger savings. Crafty Crab Seafood's 19-location operation, for example, could potentially save six figures annually from a disciplined waste-reduction program applied across all stores.
And remember: every dollar saved in food waste drops straight to the bottom line. There is no COGS, no labor, no overhead associated with not throwing food away. On a 6% net margin, saving $8,713 in food waste has the same profit impact as generating $145,000 in new revenue.
"We started tracking waste by category — overproduction, spoilage, plate waste, prep waste — and reviewing it every Monday in our manager meeting. In three months our food cost dropped from 34% to 31%. That 3% on $50,000 a month in food sales is $1,500 per month, $18,000 per year. And we did not change the menu or raise prices." — KwickOS restaurant operator, multi-unit casual dining
Getting Started This Week
You do not need to implement all ten strategies at once. Start with the waste audit. Spend one week measuring where your waste actually comes from. Then attack the largest category first. For most restaurants, that means addressing overproduction through better demand forecasting and right-sized pars.
The tools you need are straightforward: a POS system with item-level sales reporting, an inventory management process (even a spreadsheet works to start), portioning tools at every station, and a weekly review cadence. If your current POS does not provide the granular sales and inventory data required for data-driven waste reduction, that is a system limitation worth addressing — because the ROI on better data is measured in thousands of dollars per year.
Use our food cost calculator to benchmark your current food cost percentage, and our profit margin calculator to see how waste reduction translates to bottom-line improvement.
Turn Waste Data Into Profit
KwickOS gives you real-time food cost tracking, item-level sales reporting, and inventory management — the foundation for eliminating waste across your entire operation.
Book Your Free Demo