 Tom Jin
Open your last inventory report. Look at the shrinkage line.
Now look at the hours column — the total time your staff spent counting product instead of selling it.
If you are running a retail store with 3,000 SKUs and doing manual counts, your team is spending somewhere between 600 and 847 hours per year counting inventory. That is 21 full work weeks. Almost half a year of a full-time employee's labor — spent walking aisles with a clipboard.
Here's the thing: those counts are not even accurate. Manual inventory has a 1-3% error rate per count. On a $500,000 annual inventory, that is $5,000 to $15,000 in phantom stock — products your system says you have but your shelves do not.
Barcode scanning drops that error rate to 0.02%. And it turns a 16-hour full count into a 2-hour scan.
You are not just losing time to manual counts. You are losing sales every time a customer asks for something your system says is in stock but is not.
This guide covers everything: barcode types, scanner hardware, cycle counting strategy, low-stock alerts, and multi-location sync. By the end, you will know exactly how to set up an inventory system that runs itself — and stops the silent hemorrhage of miscounted stock.
The True Cost of Manual Inventory (It Is Worse Than You Think)
Most retail owners know manual counting is slow. What they do not realize is how the slowness compounds into real dollar losses across every part of the business.
Let us break it down for a mid-size retail store doing $600,000/year in revenue with 3,000 active SKUs:
| Cost Category | Manual Counting | Barcode Scanning |
|---|---|---|
| Annual counting hours | 847 hours | 104 hours |
| Labor cost (@ $16/hr) | $13,552 | $1,664 |
| Error rate | 1-3% | 0.02% |
| Phantom stock losses | $5,000-$15,000 | ~$100 |
| Lost sales (stockouts) | $8,400/year | $600/year |
| Total annual cost | $26,952-$36,952 | $2,364 |
That is a $24,588 to $34,588 gap. And it does not even account for the opportunity cost — what your staff could have been doing on the sales floor instead of counting boxes in the back room.
But it gets worse: stockouts caused by inaccurate inventory do not just cost you one sale. Research from IHL Group shows that 37% of customers who encounter an out-of-stock item will buy it from a competitor instead. And 21% will not come back to your store at all.
Every miscount is not just an inventory error. It is a customer you may never see again.
Barcode Types: 1D vs 2D and What Your Store Needs
Before you buy a scanner, you need to understand what you are scanning. There are two fundamental barcode categories, and picking the wrong scanner for your barcode type is a $300 mistake that slows down every transaction.
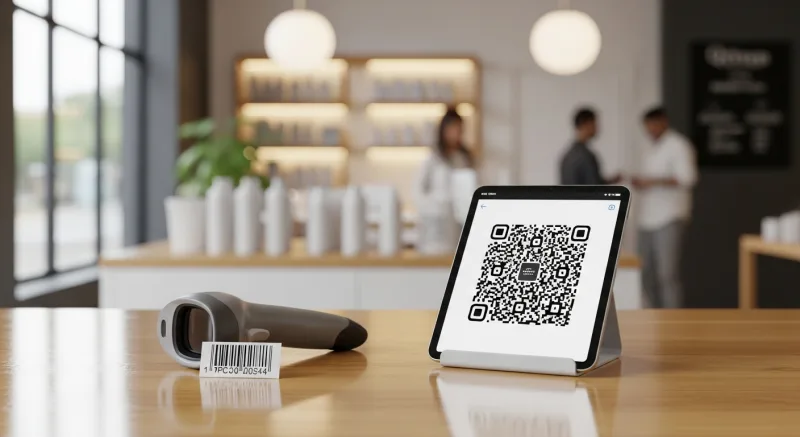
1D Barcodes (Linear)
These are the classic barcodes you have seen your entire life — parallel lines of varying widths. They include:
- UPC-A — 12-digit code on virtually every consumer product sold in North America. If you sell packaged goods, this is 90% of what you scan.
- EAN-13 — 13-digit international version of UPC. Common on imported products.
- Code 128 — High-density format used for shipping labels and internal SKUs. Encodes full ASCII characters.
- Code 39 — Older format still used in some manufacturing and logistics. Alphanumeric but lower density.
1D barcodes hold 12-20 characters of data. For most retail stores selling packaged consumer goods, 1D scanning handles everything you need at checkout.
2D Barcodes (Matrix)
These store data both horizontally and vertically in a square or rectangular pattern:
- QR Code — Holds up to 7,089 characters. Used for customer-facing applications: loyalty program enrollment, product information links, digital receipts.
- Data Matrix — Compact 2D format used on small components, pharmaceuticals, and serialized items. Holds up to 2,335 characters.
- PDF417 — Stacked linear format used on shipping labels, driver's licenses, and boarding passes.
And that's not all: 2D barcodes are becoming critical for retail inventory because they can encode batch numbers, expiration dates, serial numbers, and lot codes in a single scan. If you sell perishable goods, supplements, cosmetics, or any serialized products, you need 2D capability.
Our recommendation: Buy 2D scanners even if you only need 1D today. 2D scanners read both formats. The price difference is $30-$50, and you future-proof your setup.
Choosing the Right Scanner: Handheld, Countertop, or Mobile
Scanner choice depends on two factors: where you scan (checkout vs. warehouse vs. sales floor) and how many scans per day you process.
| Scanner Type | Best For | Speed | Price Range |
|---|---|---|---|
| Wired handheld (USB) | Low-volume checkout, tight budget | Fast (0.3 sec) | $50-$150 |
| Wireless handheld (Bluetooth) | Inventory counts, flexible checkout | Fast (0.3 sec) | $150-$300 |
| Countertop presentation | High-volume checkout (grocery, convenience) | Fastest (0.1 sec) | $200-$400 |
| Mobile device (phone camera) | Inventory walks, receiving, spot checks | Moderate (1-1.5 sec) | $0 (use existing phone) |
| Rugged mobile scanner | Warehouse, outdoor, high-drop environments | Fast (0.3 sec) | $400-$800 |
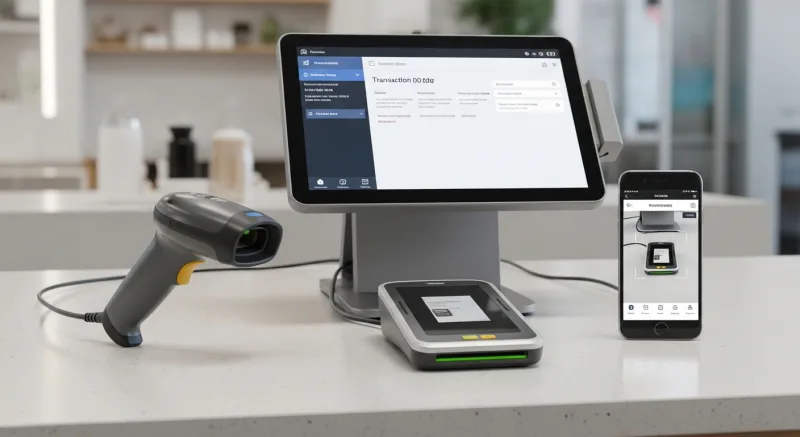
Here's the thing: most retail stores need at least two scanner types. A countertop or wired handheld at the register for checkout, and a wireless handheld or mobile device for inventory counts and receiving.
KwickOS supports all scanner types through standard USB-HID and Bluetooth connections, plus phone camera scanning for inventory walks. No proprietary hardware lock-in — use any scanner from any manufacturer.
Setting Up Your Barcode System: The 5-Step Process
Getting barcodes working in your store is not complicated. But skipping steps creates headaches that multiply over time. Follow this sequence exactly.
Step 1: Audit Your Product Catalog
Before you scan anything, you need to know what has barcodes and what does not. Walk your store and categorize every product:
- Pre-barcoded products — Manufacturer UPC codes already on packaging. These just need to be matched to your POS product database. This is typically 60-80% of products in a general retail store.
- Non-barcoded products — Handmade items, bulk goods, produce, custom products. These need in-house barcode labels.
- Multi-pack or bundle products — Require separate SKUs from individual items.
Step 2: Create Internal SKUs for Non-Barcoded Items
For products without manufacturer barcodes, you need to create internal SKUs and print barcode labels. Use a consistent naming convention:
- Category prefix (2 characters) + product number (4 digits) + variant (2 digits)
- Example: JW-0042-BL = Jewelry, product 42, Black variant
Print labels using Code 128 format on a thermal label printer ($100-$200). Budget about $0.02 per label for thermal label stock. A store with 500 non-barcoded products needs about $10 in labels — plus 2-3 hours to label everything the first time.
Step 3: Import or Build Your Product Database
Your POS system needs every product linked to its barcode. Most modern POS systems let you:
- Import product databases via CSV (manufacturer barcode, name, price, category, cost)
- Scan-to-add: scan a barcode and fill in the product details on the spot
- Bulk import from supplier catalogs
With KwickOS, the scan-to-add workflow takes about 8 seconds per product: scan barcode, type name, set price, assign category, done. For a 3,000-SKU store, expect 2-3 days of setup if starting from scratch. If you are migrating from another POS, CSV import can load your entire catalog in minutes.
Step 4: Configure Inventory Tracking Rules
Once products are in the system, set up the rules that make inventory management automatic:
- Reorder points — The minimum stock level that triggers a low-stock alert. Set this based on lead time and average daily sales. If a product sells 3 units/day and your supplier takes 5 days to deliver, your reorder point is 15 + a safety buffer of 5 = 20 units.
- Par levels — The ideal stock level you want to maintain. This is your reorder point plus enough stock to cover the lead time again. In the example above, par level = 35 units.
- ABC classification — Categorize products by revenue contribution. A-items (top 20% of products that generate 80% of revenue) get counted weekly. B-items get counted monthly. C-items get counted quarterly.
Step 5: Train Staff and Go Live
Here is where most implementations fail. The technology is simple — the human adoption is the bottleneck.
Training should cover three scenarios and take no more than 1 hour total:
- Checkout scanning (15 minutes) — Pick up item, scan, bag. Handle no-scan situations (damaged barcode, missing label). Override and manual entry as fallback.
- Receiving inventory (20 minutes) — Scan each item as it comes off the truck. Verify quantity matches the purchase order. Flag discrepancies immediately.
- Cycle counting (25 minutes) — Open count session in POS, scan section, enter quantities, review variances, submit count.
At Rockin' Rolls Sushi Express, staff across 3 stores with 49 iPad stations were fully trained on the KwickOS scanning and KDS system in under 5 minutes per employee. The interface is designed so that if you can use a smartphone, you can use the POS.
Cycle Counting: The Strategy That Eliminates Full-Store Shutdowns
Full inventory counts are a relic. Closing your store for a day (or even staying late for 6 hours) to count every item is expensive, disruptive, and still inaccurate because tired employees miscount.
Cycle counting replaces the annual shutdown with small, frequent counts that are faster, more accurate, and never disrupt operations.
Here is how to structure it:
| Classification | % of SKUs | % of Revenue | Count Frequency | Time Per Count |
|---|---|---|---|---|
| A-items | 20% | 80% | Weekly | 30-45 min |
| B-items | 30% | 15% | Monthly | 45-60 min |
| C-items | 50% | 5% | Quarterly | 60-90 min |
With this schedule, you spend about 2-3 hours per week on inventory counting — down from the 16-hour quarterly nightmare. And because A-items are counted weekly, you catch theft and shrinkage on your highest-value products within days instead of months.
The variance report is your new best friend. After each cycle count, your POS generates a variance report showing the gap between expected and actual quantities. Any variance over 2% on an A-item should trigger an immediate investigation — was it theft, receiving error, checkout mistake, or damage?
Over 30 years in IT and 20 years working with retail and restaurant operations, I have seen one pattern repeat endlessly: the businesses that count more frequently lose less inventory. Not because counting prevents theft — but because knowing you will be caught prevents theft.
Low-Stock Alerts: Never Lose a Sale to an Empty Shelf Again
Stockouts are the silent killer of retail revenue. A customer walks in, does not find what they want, and leaves. You never know it happened. There is no line item in your P&L that says "revenue lost because shelf was empty."
But the numbers are staggering. The IHL Group estimates that global retailers lose $1.14 trillion annually to out-of-stock situations. For a single retail store, that translates to roughly 4-8% of potential revenue — $24,000 to $48,000/year on a $600,000 store.
Automated low-stock alerts fix this by removing the human element from reordering decisions:
- Push notifications when any product hits its reorder point
- Daily summary emails listing all items below par level
- Automated purchase order drafts that you review and approve with one click
- Velocity tracking that adjusts reorder points based on actual sales trends (an item that sold 2/day last month but is selling 5/day this week needs a higher reorder point)
With KwickOS, low-stock alerts work in real-time because inventory is tracked at the local level with 1ms latency. Every sale, every return, every receiving event updates stock levels instantly — not after a nightly batch sync. And because KwickOS uses a hybrid local+cloud architecture, alerts fire even if your internet drops temporarily. The local system keeps tracking; the cloud catches up when connectivity returns.
Multi-Location Inventory: One Dashboard, All Your Stores
If you operate more than one location, inventory management either makes you or breaks you. The question is not whether to centralize — it is how quickly you can get there.
Here is what multi-location inventory management looks like when it works:
- Real-time stock visibility across all stores — See what every location has in stock from a single dashboard. A customer at Store A asks for a product you do not have? Check Store B's stock in 3 seconds and offer to transfer or redirect.
- Inter-store transfers — Create transfer orders that deduct from one location and add to another. Both stores' inventory updates instantly.
- Centralized purchasing — Place one purchase order that distributes across locations based on each store's reorder needs. Bulk buying = better pricing.
- Location-specific reorder points — Your downtown store sells 50 units/week of a popular item while your suburban location sells 15. Each store gets its own reorder triggers.
- Consolidated reporting — Total inventory value, shrinkage rates, turnover velocity, and dead stock — across all locations in one report.
Crafty Crab Seafood runs 19 locations with 152 terminals on KwickOS. When they update pricing or add a new menu item, one click syncs it across all 19 stores. The same principle applies to inventory — a product added at headquarters appears at every location immediately. No manual re-entry. No spreadsheet transfers. No "I forgot to update Store #7."
T. Jin China Diner operates 15 stores with 75 terminals and uses KwickOS's remote monitoring to track inventory and sales across every location in real-time. The owner can see which locations are running low on key ingredients before the staff even notices — from a phone, anywhere in the country.
The Hidden Inventory Killer: Your POS System's Architecture
Here is something most retail owners never consider: how your POS system processes data determines whether your inventory numbers are trustworthy.
Cloud-only POS systems (like Shopify POS or Square) process every transaction through remote servers. That means:
- Every scan, every sale, every inventory adjustment travels to the cloud and back
- Typical latency: 20-200ms per transaction depending on internet quality
- If your internet drops, your inventory tracking stops — or worse, creates duplicates when it reconnects
- During peak hours with 50+ simultaneous transactions, cloud lag can cause phantom stock discrepancies
KwickOS uses a fundamentally different approach: hybrid local+cloud architecture. Every transaction is processed locally first (1ms latency), then synced to the cloud for backup and cross-location visibility.
This means:
- Inventory updates in 1ms, not 200ms — no lag even during Black Friday rush
- If internet goes down, your store keeps operating with perfect inventory tracking
- No cloud-sync conflicts or duplicate transactions
- Multi-language support (English, Chinese, Spanish) for diverse retail teams
And because KwickOS is processor-agnostic, you are not locked into expensive proprietary hardware. Use any barcode scanner, any receipt printer, any payment terminal. That saves you $3,000 to $8,000 per year in processing fees alone compared to locked-in systems like Square or Shopify POS that force you to use their payment processing.
Shrinkage Detection: How Your POS Catches What Cameras Miss
Security cameras show you who stole. Your POS data shows you what was stolen, how much, and when it happened — even if nobody was watching the camera feed.
Here are five POS-based shrinkage indicators that every retail owner should monitor:
- Void rate by employee — Average void rate across retail is 1-2%. An employee voiding 5%+ of transactions needs investigation. KwickOS tracks this per employee using fingerprint 1:N authentication — no buddy punching, no shared logins, no "I don't know who voided that."
- Discount pattern analysis — Employee applying "damaged goods" discounts every Tuesday evening? The POS sees the pattern even if the manager does not.
- Inventory variance by category — If high-value portable items (electronics, cosmetics, accessories) show consistently higher shrinkage than bulky items, you have a theft vector, not a counting error.
- No-sale drawer opens — Every time the cash drawer opens without a sale transaction, the POS logs it. More than 3-4 per shift is a red flag.
- Refund-to-same-card frequency — Refund fraud is the second-most-common form of retail shrinkage. Track refund frequency by employee and by customer payment method.
At Diva Nail Beauty, moving to KwickOS with automated commission tracking across 4 stores resulted in a 90% increase in operational efficiency. The same visibility that tracks commissions also catches discrepancies — when every transaction is fingerprint-authenticated and digitally logged, there is nowhere for shrinkage to hide.
ROI Timeline: When Barcode Scanning Pays for Itself
Let us do the math on the full investment:
| Item | Cost |
|---|---|
| 2D wireless scanner (checkout) | $200 |
| 2D wireless scanner (inventory) | $200 |
| Thermal label printer | $150 |
| Label stock (year supply) | $40 |
| Setup labor (catalog + labeling) | $400 |
| Total investment | $990 |
Annual savings from the table earlier: $24,588 to $34,588.
Payback period: 11-15 days.
This is not a "maybe it pays off in two years" investment. This is a "$990 decision that returns $25,000+ per year" investment. There is no retail technology with a better ROI.
Want to run the exact numbers for your store? Use our inventory ROI calculator to see your specific savings based on SKU count, current counting method, and staff hourly rate.
Getting Started: Your First Week
Do not try to perfect everything at once. Here is the realistic week-one plan:
- Day 1-2: Audit products, identify what needs internal barcodes. Order scanners and label printer.
- Day 3-4: Set up product database in your POS. Import pre-barcoded items via CSV. Scan-to-add non-barcoded items.
- Day 5: Print and apply internal barcode labels. Configure reorder points for A-items (top 20% products).
- Day 6: Train staff (1 hour). Run your first full barcode-scanned inventory count.
- Day 7: Review variance report. Set up low-stock alerts. Start cycle counting schedule.
By day 7, you have a working barcode inventory system. Over the next month, fine-tune reorder points based on actual sales data and expand B-item and C-item tracking.
If you run multiple locations, start with one store. Get the process dialed in over 2 weeks, then replicate to remaining locations. This is exactly how operators like T. Jin China Diner scaled KwickOS across 15 stores — nail the workflow at one location, then deploy the template everywhere else.
Stop Counting by Hand
KwickOS gives you barcode scanning, real-time inventory tracking, multi-location sync, and low-stock alerts — all in one platform with no hardware lock-in. See how it works for your store.
Get a Demo