 Ming Ye
Think about last Tuesday. Did you have the right number of people on the floor?
Probably not exactly. Most restaurants run one of two ways: over-staffed on a slow night, paying three servers to refill each other's water — or under-staffed when a rush nobody saw coming turns a 40-minute wait into a wall of one-star reviews. Either way, you lost money. You just lost it quietly.
Here's the thing: that guessing game isn't a skill problem. Even great operators can't hold a year of daily patterns in their head, cross-referenced against weather, paydays, and the concert two blocks away. So they round to a feeling — "Thursdays are usually decent" — and staff and order to the feeling.
But it gets worse. The cost of a bad guess isn't symmetric. Over-prep and you eat the food cost as waste. Under-prep and you 86 your best-selling item at 7 p.m. on the busiest night of the month — turning away the exact customers who drive your margin. You're not choosing between right and wrong. You're choosing which way to be wrong.
Predictive analytics ends the coin flip. It takes the data you're already collecting at every checkout and turns it into a specific, usable sentence: "Next Tuesday, March 15, will run about 23% busier than a normal Tuesday — prep accordingly." This guide breaks down exactly how that works, what data it needs, and how to put it to work by Monday.
What Predictive Analytics Actually Is (It's Not a Crystal Ball)
Let's kill the mystique first. Predictive analytics isn't artificial intelligence dreaming up the future. It's pattern math. It looks at what happened under similar conditions before, weights the most relevant examples, and projects the most likely outcome — with a confidence range attached.

The honest version sounds like this: "On the last eight Tuesdays that followed a payday and had temperatures above 75°F, you averaged 218 covers, 22% above your baseline Tuesday of 178. Next Tuesday matches that pattern. Plan for ~215, and don't be shocked by 230."
That's it. No magic — just your own history, organized. The reason it feels like magic is that no human can do this manually. You'd need to remember every Tuesday for a year, tag each one with weather and local events, and run the averages in your head before the truck order is due at 9 a.m. The computer does it in a second. You just read the answer.
And the answer is only as good as the data feeding it. Which brings us to the part most owners overlook: the goldmine is already in your building.
Your POS Is Already Sitting on the Answer
Every time a ticket closes at your register, your point-of-sale system records more than a total. It captures what sold, when it sold, how many guests were in the party, which server rang it, and whether they paid by card, cash, gift card, or loyalty redemption. Multiply that by a year of checkouts and you have tens of thousands of labeled data points describing exactly how your restaurant behaves.
That checkout data is the raw fuel for every forecast. The cleaner and more complete it is, the sharper the prediction. This is the quiet reason a modern POS matters beyond just taking payment: if half your sales run through a side channel that never hits the system, your history has holes, and holes make forecasts guess.
From that single stream, predictive analytics pulls three layers of pattern:
- Day-of-week rhythm. Your Fridays aren't your Mondays. Within about 8–12 weeks of clean data, the system learns each day's normal shape — including the double-hump of a lunch-and-dinner house versus the single evening wave of a dinner-only spot.
- Daypart curves. Not just "busy day," but when busy. Knowing that Saturday's rush front-loads to 6:30 p.m. changes your prep and your schedule more than the daily total ever could.
- Item-level velocity. Which dishes move on which days. Your brisket may sell out Saturdays but sit midweek — so your prep par isn't one number, it's seven.
Once those baselines exist, the interesting work begins: adjusting them for the things that make next week different from an average week.
Weather: The Variable That Quietly Moves 15% of Your Covers
Here's a number that surprises most operators: day-to-day weather can swing your covers by 10 to 20 percent — and, just as importantly, it changes what people order.

A cold, rainy Wednesday empties your patio and kills iced-drink sales, but it lights up delivery and comfort food. A first warm Saturday of spring pulls people out of their houses and packs your dining room. Restaurant industry data consistently shows temperature and precipitation among the strongest short-term predictors of foot traffic — and unlike most variables, the forecast is public and available days ahead.
That lead time is the whole point. Because you can see Thursday's storm coming on Monday, weather is one of the rare high-impact factors you can actually plan around:
- Prep: Shift the prep list toward soups, braises, and delivery-friendly items on a cold-and-wet forecast; dial back on salads and cold apps that'll die on the line.
- Staffing: Move a floor server to the expo or delivery-pack station when the forecast says the dining room thins but online orders spike.
- Specials: Push a hot special or a rainy-day delivery deal you scheduled two days ahead instead of scrambling day-of.
Predictive analytics folds the weather forecast into your baseline automatically: "Normal Wednesday is 160 covers, but the 40°F rain historically pulls that down about 12% in the dining room and pushes delivery up 18%. Plan for 140 in-house, staff delivery heavier." That's a plan. "It might be slow if it rains" is a shrug.
Events: The Concert Two Blocks Away Is on Your P&L
Weather is the universal variable. Local events are the personal one — and they're where generic industry benchmarks fall apart, because nobody knows your block like your own data does.
A home game, a downtown festival, a convention at the hotel up the street, a school letting out for summer, the 15th and 30th when paychecks land — each of these bends your demand, and each leaves a fingerprint in last year's sales. Predictive analytics learns those fingerprints by correlating past spikes with the calendar:
- Recurring events like paydays, farmers markets, and monthly gallery nights become standing adjustments the system applies automatically.
- Annual events like the marathon or the county fair get compared year-over-year, so this year's forecast starts from last year's actual instead of a blank guess.
- One-off events you flag — a stadium concert, a big convention — get matched to the closest historical analog so you're not planning from zero.
This is also where multi-location operators pull ahead. When you run several restaurants, a pattern proven at one location — say, how a nearby sporting event lifts late-night orders — becomes a template you can apply the first time a similar event hits a newer store. That's exactly the kind of cross-location intelligence T. Jin China Diner (15 stores, 75 terminals) and Crafty Crab Seafood (19 stores, 152 terminals) can act on: not fifteen separate guessing games, but one shared body of evidence read across every location from a single dashboard.
From Forecast to Inventory: Order What You'll Actually Sell
A forecast you don't act on is trivia. The first place it pays for itself is the walk-in.
Once you have item-level velocity plus next week's demand adjustment, predictive analytics can suggest par levels that match reality instead of habit. If next Saturday projects 23% above baseline and your brisket sells at 0.4 lbs per cover, the math writes your prep order for you — and flags the sell-out risk before it 86s at 8 p.m.
The savings cut both ways, which is the beauty of it:
- You stop over-ordering for the slow days you used to pad "just in case," which is where food waste — and cash — quietly dies. Industry research suggests food waste eats a meaningful slice of a typical restaurant's food cost; tightening pars against real forecasts is one of the few levers that recovers it without touching quality.
- You stop running out on the busy days, when a stockout doesn't just cost that sale — it sends your highest-value guests to a competitor and dents the review score that fills future tables.
The same forecasting logic extends to a revenue line most owners treat as random: gift cards. Gift card and e-gift card sales aren't evenly spread — they spike hard around the winter holidays, Mother's Day, Father's Day, and graduation. Predictive analytics reads that seasonal curve straight out of your history, so you can pre-load physical card stock, schedule your e-gift card promotions to land before the peak instead of during it, and even forecast the redemption wave that follows in January. Selling a stack of gift cards in December is guaranteed revenue banked before a single plate goes out — but only if you're staffed and stocked for the redemptions that come back. If you want to see the mechanics of the program itself, our gift card system guide covers setup end to end.
Staffing: Schedule the Crew the Day Will Actually Need
Labor is your most controllable major cost and your most perishable one — an over-staffed hour is gone the moment it passes. This is where accurate demand forecasting turns directly into margin.
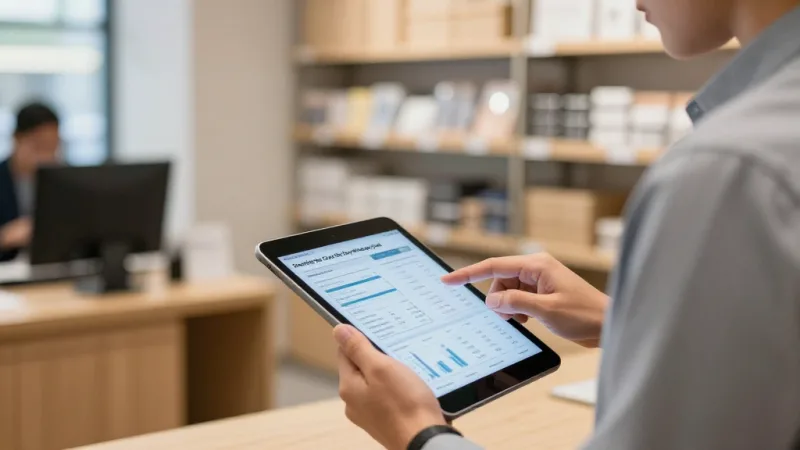
Because predictive analytics works at the daypart level, it doesn't just say "Saturday will be busy." It says when. If the model shows Saturday's rush front-loading to 6:00–8:30 p.m. and tapering fast after nine, you schedule the heavy coverage into the peak and cut the tail instead of carrying a full floor until close out of habit. Match labor to the curve and the same sales support a lower labor percentage — without anyone feeling slammed.
Run it forward across a week and the picture gets sharper still:
- Right-size each shift to its forecast instead of copy-pasting last week's schedule.
- Protect service on the spikes by adding coverage where the model flags a surge, so you're not trading labor savings for bad reviews.
- Give staff earlier, steadier schedules — a quieter operational win that cuts turnover, because people can plan their lives around shifts that reflect real demand.
Curious what small labor-percentage moves are worth on your volume? Run the numbers with our free restaurant calculators and planners before you rebuild next week's schedule.
Your Loyalty Program Is a Demand Signal You're Not Reading
Here's the layer almost nobody uses: your regulars are predictable, and predictability is exactly what a forecast is made of.
A loyalty, membership, or points program does more than drive repeat visits — it tags who came, how often, and on what cadence. That turns anonymous covers into a rhythm you can forecast. When predictive analytics reads loyalty data alongside checkout data, it surfaces patterns like:
- Visit cadence. Your best members show up on a knowable clock — every 9 days, every other Friday. A dip in expected visits is an early warning to fire a win-back offer before they churn, not after.
- Redemption timing. Points and rewards get burned in predictable waves — a rewards push lands demand you can staff and stock for, instead of a surprise rush.
- Membership floors. A paid membership or subscription program creates a base of near-guaranteed visits, which raises the confidence of every forecast built on top of it.
The strategic move is to stop treating loyalty as a marketing coupon and start treating it as a demand instrument. The more of your covers you can attach to a known guest, the less of your future you're guessing at. (If you're still weighing program structures, our comparison of points versus membership models lays out which fits which business.)
How KwickOS Makes This Practical
Everything above assumes two things that trip up most restaurants: complete data, and a system fast enough to act on it. This is the part I spend my days on.
Because KwickOS is an all-in-one platform, every checkout, item, gift card sale, and loyalty visit already lands in one place — there's no stitching together a POS export, a spreadsheet, and a separate loyalty app before you can forecast anything. The history is clean by default because it was never split up.
The second piece is our hybrid local-and-cloud architecture. Forecasts, suggested par levels, and staffing recommendations run against the cloud where the heavy math lives, but the register keeps operating at 1ms local latency and keeps recording data even when the internet drops — so your history never develops the gaps that poison a prediction. For a multi-location operator, that means one demand picture across every store, on your phone, without waiting on a back-office report. Explore how it fits your concept on our industry solutions pages, or see it head-to-head with legacy systems on our POS comparison page.
None of this replaces your judgment. What it does is smaller and more valuable: it hands you next week's most likely shape before you order a single case or write a single schedule — so you're managing a plan instead of reacting to a surprise.
Stop Guessing at Next Week
KwickOS turns the checkout, gift card, and loyalty data you already collect into demand forecasts, suggested par levels, and staffing recommendations — on your phone, across every location. See what your own history has been trying to tell you.
Explore Free Restaurant Tools
Frequently Asked Questions
What is predictive analytics for a restaurant?
Predictive analytics uses your restaurant's own historical POS data — sales by day, hour, and item — combined with outside signals like weather and local events to forecast how busy a specific future day or shift will be. Instead of guessing how much brisket to prep or how many servers to schedule, you get a data-backed estimate such as "next Tuesday will run 23% above a normal Tuesday," letting you order inventory and staff to actual expected demand.
How much historical data do I need before forecasts get accurate?
A useful weekly pattern emerges after about 8 to 12 weeks of clean POS data, because that is enough to separate a normal Monday from a normal Friday. Seasonal and holiday forecasts need a full year so the system can compare this year's Mother's Day to last year's. The more complete your checkout data — every item, every daypart — the sooner the forecasts stabilize, which is why capturing everything at the point of sale matters.
Does weather really affect restaurant sales that much?
Yes. Temperature, rain, and snow can swing daily covers by 10 to 20 percent, and they shift what people order — hot soup and delivery spike in bad weather while patio and cold-drink sales fall. Because forecasts are published days ahead, weather is one of the few high-impact variables you can plan around, adjusting prep, delivery staffing, and specials before the day arrives rather than reacting to a slow or slammed dining room.
Can my POS system do predictive analytics automatically?
An all-in-one platform like KwickOS already stores every checkout, item, gift card sale, and loyalty visit, so the forecasting layer runs on data you are collecting anyway. Because KwickOS uses a hybrid local-and-cloud architecture, demand forecasts, suggested par levels, and staffing recommendations are available on your phone across every location without exporting spreadsheets. Resellers can offer the same forecasting to their merchants through the KwickOS partner program.