 Kelly Ho
You already have the data.
Every order, every void, every 2 p.m. lull and every Friday rush is sitting inside your point-of-sale system right now — thousands of tiny facts about how your restaurant actually makes money.
Here's the problem: almost none of it is being read. The average independent operator glances at one number — the daily sales total — and walks away. That single number is like reading the last page of a mystery novel. It tells you what happened. It tells you nothing about why, or what to do tomorrow.
And it gets worse. While you're flying blind, the profit is leaking in places you can't see: a "best-selling" dish that actually loses money, a Tuesday night overstaffed by two people, a regular who used to come in weekly and quietly stopped three months ago. Industry research suggests that better use of existing sales and labor data can lift a restaurant's margin by two to four points — on a business doing $1.2M a year, that's roughly $24,000 to $47,000 you're leaving on the table.
The good news? You don't need to become an analyst. You need to learn to read six numbers your POS is already collecting. Let's walk through them one at a time — no spreadsheets, no jargon, no math degree required.
First, a Reframe: Analytics Is Just Listening to Your Restaurant
Forget the word "analytics" for a second. What we're really talking about is listening. Your restaurant is talking to you all day long — through what sells, when it sells, who buys it, and what ends up in the trash. Data analytics is nothing more than turning up the volume on that conversation.
The trap most beginners fall into is thinking they need to track everything. You don't. Tracking fifty metrics badly is worse than tracking six well. So here's the rule for your first ninety days: master these six numbers, and ignore the rest until they're second nature.
Number 1: Sales Trends (Compare, Don't Just Count)
A daily sales total on its own is meaningless. "We did $6,400 today" — is that good? You have no idea until you answer one question: compared to what?
Real sales analysis is always a comparison. The two that matter most for beginners:
- Same day, last year. This Friday versus the same Friday twelve months ago. It controls for the day of the week and the season, so you're comparing apples to apples.
- Rolling trend. Your last four weeks stacked against the previous four. This smooths out one-off good and bad days and shows you the real direction you're heading.
Here's the thing: a restaurant can feel busy and still be shrinking. If your average check crept up 6% because of a menu price increase but your customer count dropped 11%, your "steady" sales are hiding a slow bleed of guests. Only the comparison reveals it.
A modern POS does this automatically — no exporting, no formulas. It shows you today next to last year, flags the movement in green or red, and lets you drill into any day. Owners of multi-location groups like T. Jin China Diner (15 stores, 75 terminals) watch this across every location from one screen, so a soft week at store #9 gets noticed on Monday, not at the end of the quarter.
Number 2: Product Mix (Your Menu Is Lying to You)
Ask any owner their best seller and they'll answer instantly. Ask them their most profitable item and you'll get a pause — because those are almost never the same dish.
Product mix analysis (often called "menu engineering") sorts every item on your menu by two things: how often it sells, and how much profit it makes per sale. That gives you four groups:
| Category | Sells a Lot? | High Profit? | What To Do |
|---|---|---|---|
| Stars | Yes | Yes | Protect and promote — put them front and center |
| Workhorses | Yes | No | Trim the recipe cost or nudge the price up |
| Puzzles | No | Yes | Reposition, rename, or feature them — the margin is worth it |
| Dogs | No | No | Cut them — they clutter the menu and slow the kitchen |
But it gets worse for the owner who guesses: that popular appetizer everyone orders might be a "workhorse" running a 42% food cost, quietly dragging down your margin on every ticket. Meanwhile the "puzzle" dessert with an 82% margin sits buried at the bottom of page three where nobody sees it. Move it into an upsell prompt at checkout and you've turned invisible profit into real money — without adding a single new customer.
Your POS already knows the sales count for every item. Pair it with your recipe costs and the four groups sort themselves. For a deeper walkthrough, our guide on data-driven menu pricing shows exactly how to find your underpriced best sellers.
Number 3: Labor Efficiency (Sales Per Labor Hour)
Labor is usually your second-biggest cost after food, and it's the one most owners manage by feel. "It felt busy, so I kept everyone on." Feel is expensive.
The single number that fixes this is sales per labor hour — total sales divided by total hours worked in a given shift or daypart. If you did $2,000 in sales across 40 labor hours, that's $50 per labor hour. Track it by daypart and a story appears fast:
- Your lunch rush might run a healthy $75/labor hour.
- That 2–4 p.m. window? Maybe $28/labor hour — you're paying three people to watch an empty dining room.
And that's not all: shave one over-scheduled shift in that dead window, five days a week, and you've cut real cost without touching service quality during the hours that actually matter. Multiply across a month and it's often thousands of dollars.
The fingerprint clock-in on a KwickOS terminal makes this data trustworthy, too — no buddy-punching, no "I forgot to clock out," so your labor numbers reflect reality. Want to see your own ratio? Run the numbers through our labor cost percentage calculator and our daily sales report tool.
Number 4: Peak Hours (Staff the Curve, Not the Clock)
Close your eyes and picture your busiest hour. Now pull the actual hourly sales report. Owners are wrong about their own peaks more often than you'd think — because the two loudest, most stressful hours aren't always the two highest-revenue hours.
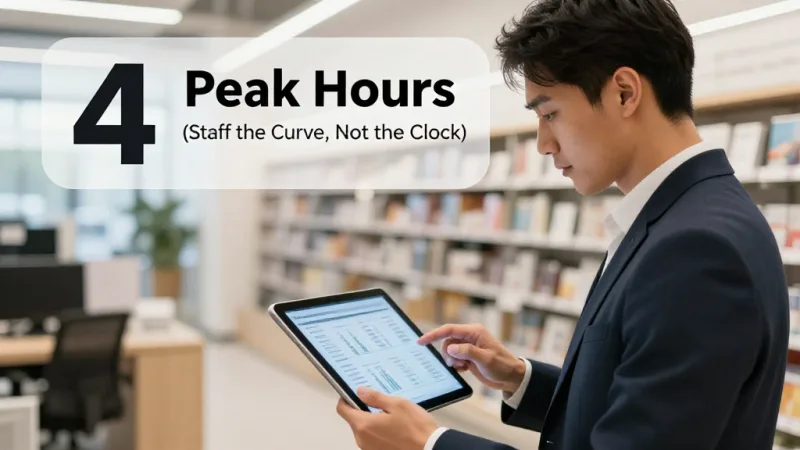
Peak-hour analysis maps demand across every hour of every day of the week. Once you can see the real curve, three things get easier:
- Scheduling: add hands right before the wave, not after it's already crashed on you.
- Prep: time your kitchen prep to land minutes before the surge, so nothing 86s at the worst moment.
- Promotions: push a happy-hour or limited-time offer into your slow hours to flatten the curve and capture revenue you're currently missing.
This is also where dynamic thinking pays off. If your data shows a dead 3–5 p.m. stretch, a members-only discount window or a "double points" happy hour can pull traffic into the gap — turning empty seats into loyalty sign-ups and full tickets.
Number 5: Customer Frequency (The Metric Hiding in Plain Sight)
Here's a number almost no beginner tracks, and it might be the most important one of all: how often do your customers come back?
Most restaurants treat every transaction as anonymous. A card taps, an order fires, the guest leaves, and they're forgotten. But repeat customers are the entire game — a small lift in return frequency compounds into your most reliable revenue. The catch is you can't improve what you can't see, and a raw checkout doesn't tell you whether the person in front of you is a first-timer or a ten-time regular.
This is exactly what a loyalty and membership program is really for. Yes, points and rewards bring people back — but the quiet superpower is the data. The moment a guest joins your loyalty program, every future visit attaches to a profile. Now you can finally see:
- Your repeat rate — what share of guests come back within 30, 60, or 90 days.
- Your lapsing regulars — the customer who came in weekly and hasn't been seen in five weeks. That's a $47-average-check relationship about to walk away, and a single automated "we miss you" text with a bonus-points offer often brings them back.
- Your best customers — the top 10% who often drive 30–40% of revenue and deserve VIP treatment.
Because KwickOS runs loyalty, points, and membership through the same system as checkout, none of this requires extra work at the counter. The guest earns points automatically when they pay, and their visit history updates itself. It's analytics that builds itself while you run the restaurant.
Number 6: Waste Patterns (The Gap Between Bought and Sold)
The last number is the one nobody likes to look at: the difference between what you purchased and what you actually sold. That gap is waste, theft, over-portioning, and spoilage — and it's pure lost profit.
You don't need a fancy system to start. When your POS tracks item-level sales and you compare that against what left your walk-in, variances jump out. If you bought enough salmon for 120 plates and only sold 96, where did the other 24 go? Some is normal trim and staff meals. A persistent, growing gap is a problem with a dollar figure attached.
Beginners should review this weekly on their top five highest-cost ingredients. That's where the money is, and it keeps the task from feeling overwhelming. For the bigger picture of how much a percentage point of margin is worth to your specific concept, our breakdown of revenue per square foot is a useful companion read.
How to Actually Build the Habit (Your Reading Schedule)
Data only pays off if you look at it consistently. Here's the beginner-friendly rhythm that works without eating your day:
| Cadence | What to Check | Time |
|---|---|---|
| Every morning | Yesterday's sales vs. last year, labor %, cover count | 5 minutes |
| Every week | Product mix, sales per labor hour by daypart, top-5 waste | 30 minutes |
| Every month | Customer frequency, loyalty & gift card performance, trend direction | 60 minutes |
The daily check catches fires early. The weekly review reveals operational patterns. The monthly deep-dive is where the strategic money lives — the customer and loyalty trends that decide whether next year is bigger than this one.
Where Gift Cards and Loyalty Fit the Analytics Picture
One last piece beginners overlook: gift cards and e-gift cards are a data goldmine, not just a revenue line. When you sell a physical or digital gift card, you're collecting cash today for a visit that hasn't happened yet — and your POS tells you the redemption rate, the average reload amount, and the seasons when they sell hardest.
That last one matters. Analytics consistently shows a huge share of annual gift card volume lands in the six weeks around the winter holidays. If your data confirms that pattern for your restaurant, you can time an e-gift card email campaign to hit right before the spike — and pair it with a "buy $50, get 500 bonus points" loyalty hook so the buyer and the recipient both re-enter your world. That's three of our six numbers (sales trends, customer frequency, and product mix) working together, all powered by the same checkout system.
This is the quiet advantage of an all-in-one platform: because POS checkout, gift cards, loyalty, points, and membership all live in one place, your analytics isn't stitched together from five disconnected tools. It's one clean, honest picture of your business.
The Bottom Line
You don't have to become a data expert to run a smarter restaurant. You have to become a good listener. Start with six numbers — sales trends, product mix, labor efficiency, peak hours, customer frequency, and waste — check them on a simple daily/weekly/monthly rhythm, and act on what they tell you.
The data has been there all along, generated by every order you've ever rung up. The operators who win aren't the ones with the most information. They're the ones who finally decided to read it. Your POS has been talking for years. It's time to listen — and if you want to see how a single connected system makes that effortless, our restaurant platform overview and team can walk you through it. Curious how KwickOS stacks up against what you're running now? Compare it head-to-head with Lightspeed.
Turn Your POS Data Into Profit
KwickOS runs POS checkout, gift cards, e-gift cards, loyalty, points, and membership in one system — so your sales, labor, customer, and waste analytics build themselves in real time, across every location. See how much your data is worth.
Get a Free DemoFrequently Asked Questions
What is restaurant data analytics, and do I need to be technical to use it?
Restaurant data analytics simply means reading the numbers your POS already collects — sales, items sold, labor hours, and customer visits — to make better decisions. You do not need to be technical or build spreadsheets. A modern POS presents these numbers as ready-made reports and dashboards. The skill is knowing which handful of numbers matter and what to do when they move, not writing formulas.
What are the most important numbers a beginner should track first?
Start with six: sales trends (are you up or down versus the same day last year), product mix (which menu items actually drive profit), labor efficiency (sales per labor hour), peak hours (when demand really spikes), customer frequency (how often guests return), and waste patterns (the gap between what you bought and what you sold). Master these before adding anything more advanced.
How often should a restaurant owner look at their analytics?
Check a short daily snapshot — yesterday's sales, labor percentage, and covers — every morning in about five minutes. Do a deeper weekly review of product mix and labor by daypart, and a monthly review of customer frequency, loyalty and gift card performance, and waste trends. Daily catches problems early; weekly and monthly reveal the patterns that actually change your bottom line.
How do loyalty and gift card data help me make better decisions?
Loyalty and gift card programs turn anonymous transactions into named customers with a visit history. That lets you see your repeat rate, spot lapsing regulars before they disappear, measure which promotions actually bring people back, and time gift card and e-gift card campaigns to your busiest seasons. Because the data lives in the same POS as your checkout, every visit and point earned updates the customer profile automatically.