 Tom Jin
Here's a question that stops most restaurant owners cold: what were your sales yesterday?
Not roughly. Not "pretty good, I think." The actual number — and next to it, your labor percentage, your covers, and how many of those checks came through online ordering.
If you had to open a spreadsheet, call your manager, or wait for your accountant to answer that, you already have your problem. And it's costing you more than you think.
Here's the thing: restaurants don't fail in one dramatic moment. They bleed out slowly — a half-point of food cost here, two extra labor hours there, a dozen comped meals nobody flagged. Each one is small enough to ignore on any given day. Stacked across a month, they're the difference between a profitable restaurant and one that's quietly working for free.
The owners who survive aren't the ones with the best instincts. They're the ones who look at the same ten numbers every single morning, before the doors open, while the problems are still small enough to fix. It takes about five minutes. Let me show you exactly what to look at — and what each number is trying to warn you about.
Why a Morning Routine Beats a Monthly Report
Your accountant shows you a profit-and-loss statement once a month. By the time you see March's numbers, it's the third week of April. If March had a labor problem, you spent all of April repeating it before you ever found out.
But it gets worse: a monthly report is an autopsy. It tells you what killed the patient. A daily dashboard is a heartbeat monitor — it tells you something's wrong while you can still do something about it.
That's the entire philosophy here. You're not trying to become an accountant. You're trying to spot the three or four mornings a month where a number is off, so you can walk into the kitchen and ask "why" before it repeats for thirty days. Everything below is built to be read in seconds, not analyzed for an hour.
The 10 Numbers, In Order
1. Net Sales (Yesterday, and vs. Same Day Last Week)
Start with the top line — but never look at it alone. Yesterday's $6,800 means nothing until you put it next to last Tuesday's $8,100. That $1,300 gap is the real signal, and it's asking a question: weather? A slow section? A server who called out? A competitor's promo?
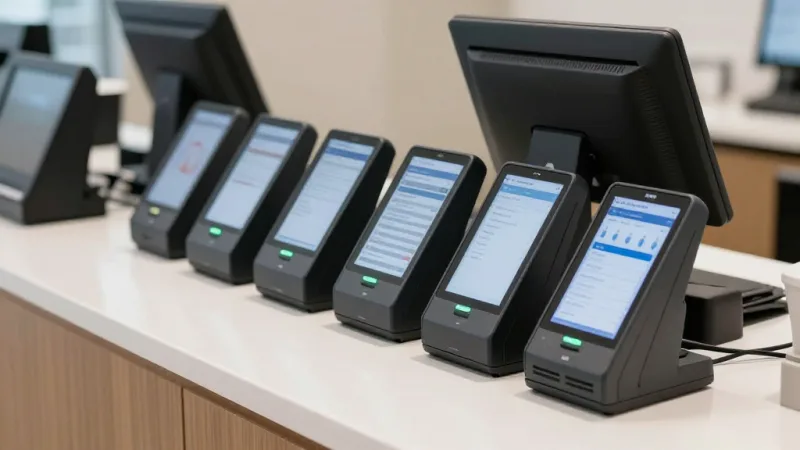
Compare day-of-week to day-of-week, not yesterday to today. Mondays are not Fridays, and comparing them will only lie to you. A good POS dashboard shows you the same-day-last-week number side by side automatically, so the comparison is done before you finish your coffee.
2. Labor Cost Percentage
This is the number that quietly eats restaurants alive. Labor cost as a percentage of sales should generally land between 25% and 35% for most full-service concepts. The trap isn't a high number on a busy day — it's a high number on a slow day, because that means you scheduled for a rush that never came.
Here's a pattern worth burning into your brain: if sales dropped 15% but labor stayed flat, your labor percentage just spiked, and you paid full price for a half-full room. Catch that on the morning-after and you can adjust tonight's schedule. Catch it in the monthly P&L and you've done it twenty more times.
3. Food Cost & Prime Cost
Food cost percentage tells you what your ingredients cost relative to what you sold. But the number that actually predicts survival is prime cost — food plus labor combined. Keep prime cost at or below 60% of sales and you have room to be profitable. Let it drift past 65% and you're working for your vendors and your staff, not yourself.
And that's not all: a sudden jump in food cost with no menu change is almost never "prices went up." It's usually over-portioning, waste, or theft. The number won't tell you which — but it'll tell you to go look, which is the whole point.
4. Covers (Guest Count)
Covers is simply how many guests you served. It's the honest twin of net sales, because sales can hide the truth. Picture two Tuesdays that both did $8,000. One served 260 guests. The other served 190. Those are two completely different restaurants having two completely different problems — and only the cover count reveals it.
Rising sales on falling covers means you're leaning on price and losing traffic — dangerous long-term. Falling sales on steady covers means guests are spending less per visit, which points you straight at the next number.
5. Average Check
Average check is net sales divided by covers — what the typical guest spent. This is the number your upselling and menu strategy lives or dies by. A $2 swing in average check across 200 covers a day is $400 a day, which is roughly $146,000 a year. From one number.
Watch it by daypart if you can. A shrinking dinner check often means your servers stopped suggesting appetizers, desserts, or that second round — the exact behaviors that erode quietly and never announce themselves.
6. Table Turnover Time
How long does a table stay occupied from seat to reset? In a full-service room, every extra ten minutes per table on a Friday night is a table you didn't turn — and a party you sent to the restaurant down the street. Turnover time is where kitchen speed, server pacing, and menu design all show up as one clean number.
Now, a pattern interrupt, because this one trips people up: faster is not always better. If turnover suddenly drops and so does average check, you may be rushing guests out the door and leaving money — and goodwill — on the table. Read it alongside numbers 5 and 8, never by itself.
7. Online Order Volume
Online and app-based orders are now a channel of their own, and they behave differently than your dining room. Track how many orders came through your own first-party ordering versus third-party marketplaces — because that mix is a profit story. Every order you push to your own channel instead of a 25%-commission app is margin you keep.
A morning glance here answers two questions fast: is my delivery volume trending the right way, and am I slowly becoming a franchise of DoorDash without noticing? If third-party is climbing while first-party flatlines, that's a marketing problem you want to see today, not at tax time.
8. Reviews & Rating
One-star reviews are the only KPI that talks back. A single new review overnight can tell you a station went down, a new hire is struggling, or a dish is arriving cold — intelligence no financial report will ever give you. Scan new reviews every morning and your star rating becomes a live quality sensor instead of a scoreboard you check once a quarter.
Loss aversion is real here: research across the hospitality industry consistently suggests that a single lost star on your public rating can cost a meaningful slice of revenue. You're not managing reviews for ego — you're protecting the number that decides whether a stranger picks you or the place next door.
9. Gift Card & Loyalty Activity
This is the number most owners never put on their dashboard, and it's a mistake. Gift cards — physical and e-gift cards — are the closest thing a restaurant has to free money: a customer pays you today for food you'll serve later, and a well-known share of that balance is never fully redeemed. Track daily gift card sales and outstanding balance, and watch it climb heading into holidays.
Then look at loyalty. How many members enrolled yesterday? How many points were redeemed? A healthy loyalty and membership program shows steady enrollment and steady redemption — redemption is what actually drives the repeat visit. If enrollment is happening at the point of sale but redemption is flat, your rewards aren't compelling enough to bring anyone back, and you're paying for a program that isn't working. That's a five-second read that most owners don't even have access to.
10. Checkout Integrity: Voids, Comps & Payment Mix
The last number lives inside your POS checkout data, and it's the one dishonest employees are counting on you to ignore. Every void, every comp, and every "no sale" drawer open is logged. A morning glance at yesterday's voids-and-comps total — and which employee attached to them — is the single cheapest loss-prevention tool you own.
Here's what to watch: a spike in voids on one server's checks, comps that cluster around one manager's shift, or a cash-heavy day when card volume is trending up everywhere else. None of these prove anything on their own. All of them tell you exactly where to look. With fingerprint-authenticated logins, every one of those actions is tied to a real person, not a shared four-digit PIN that half the staff knows.
How T. Jin China Diner Runs 15 Stores From One Screen
When you operate more than one location, this morning routine stops being a nice habit and becomes the only way to stay sane. T. Jin China Diner runs 15 stores and 75 terminals — and the owner does not drive to fifteen buildings to read fifteen reports.
Instead, the KwickOS dashboard rolls all fifteen locations into one screen: net sales and covers by store, labor percentage flagged in red where it's over target, online order mix, and gift card and loyalty activity across the whole group. Because the platform runs a hybrid local-and-cloud architecture, each store keeps 1-millisecond local speed at the register while the numbers sync to the owner's phone in real time. Five minutes over coffee replaces a full morning of phone calls — and the outlier store that's quietly slipping gets a call before lunch, not at the end of the month.
Crafty Crab Seafood does the same across 19 stores and 152 terminals. The lesson isn't "buy more software." It's that the numbers only prevent surprises if they're all in one place, updating on their own, the moment you wake up.
Build the Habit Before You Build the Dashboard
You can start tomorrow with a notepad. Write these ten down, fill them in each morning for two weeks, and you'll already spot patterns you're blind to today. The habit is worth more than the tool.
But the habit is fragile if the data is scattered. If checking your numbers means logging into your POS for sales, a separate app for reviews, a spreadsheet for labor, and calling your manager for gift card totals, you'll do it for a week and quit. The whole point of an all-in-one platform is that the five-minute routine actually stays five minutes — sales, labor, covers, average check, online orders, voids, gift cards, and loyalty all in one view, so nothing falls off your radar because it was too annoying to look up.
Want to see how your current setup compares? Our POS comparison guides break down which platforms surface these numbers in real time and which bury them, and you can run your own break-even math with our free restaurant calculators.
The Bottom Line
Ten numbers. Five minutes. Every morning before the doors open. Net sales against last week, labor percentage, prime cost, covers, average check, turnover, online orders, reviews, gift card and loyalty activity, and checkout integrity.

None of these numbers will run your restaurant for you. What they'll do is smaller and far more valuable — they'll turn every one of your bad days into a bad morning you caught early, instead of a bad month you discovered too late. That's the entire difference between owning a restaurant and being owned by one.
See Every Number in One Morning View
KwickOS pulls sales, labor, covers, online orders, gift cards, loyalty, and checkout integrity into a single real-time dashboard — on your phone, across every location. Stop finding out on Friday.
Explore Free Restaurant Tools
Frequently Asked Questions
What are the most important restaurant KPIs to track daily?
The ten daily restaurant KPIs every owner should check are: net sales, labor cost percentage, food cost and prime cost, covers (guest count), average check, table turnover time, online order volume, reviews and rating, gift card and loyalty activity, and checkout integrity (voids, comps, and cash-vs-card mix). Together they take about five minutes to review and reveal problems before they become losses.
What is a healthy prime cost for a restaurant?
Prime cost is food cost plus labor cost combined, and most full-service restaurants aim to keep it at or below 60% of net sales. Quick-service and counter-service concepts often run lower, around 55%. If your prime cost creeps above 65%, your restaurant is likely operating at or near break-even, which is why checking food cost and labor percentage together every morning matters more than watching either one alone.
How often should a restaurant owner review KPIs?
Ten operational KPIs should be reviewed daily, ideally each morning before service, because labor overages, food cost drift, and void abuse compound quickly if left unwatched. Deeper financials such as the full profit-and-loss statement are reviewed weekly, while strategic metrics like revenue per square foot and customer lifetime value are reviewed monthly. The daily habit is what prevents the small surprises that add up to a bad month.
Can a POS system show these KPIs automatically?
Yes. A modern all-in-one POS platform like KwickOS pulls net sales, labor percentage, covers, average check, online orders, voids, comps, and gift card and loyalty activity into a single dashboard that updates in real time. Because KwickOS runs a hybrid local-and-cloud architecture, owners can pull the full morning dashboard from their phone in about five minutes without waiting on a back-office report or an accountant. Resellers can offer the same dashboard to their merchants — see our partner program.