
 Tom Jin
You check your bank account every morning. Revenue looks solid. You're covering payroll, rent, and food costs. There's money left over at the end of the month.
So you assume you're doing fine.
But here's the thing: "fine" in the restaurant industry might mean you're leaving $40,000 to $80,000 on the table every year. Because the gap between an average restaurant and a well-run restaurant isn't a few hundred dollars a month. It's the difference between a 3% net margin and an 8% net margin — on a $1.2 million operation, that's $60,000 in annual profit you're not capturing.
And that's not all: the operators who know their benchmarks and actively manage against them are pulling further ahead every quarter. They're using data to make decisions you're making on gut instinct. They're catching cost creep in week two instead of month three. They're building wealth while you're building stress.
This guide gives you every profitability benchmark that matters in 2026 — by restaurant type, by cost category, by metric. No vague advice. Just the numbers you need to know whether you're winning, surviving, or slowly bleeding out.
The Number That Matters Most: Net Profit Margin by Restaurant Type
Let's start with the bottom line. According to industry data, the average restaurant net profit margin in 2026 sits at approximately 5.8%. But that average hides enormous variation by concept type.
| Restaurant Type | Net Profit Margin | Annual Revenue (Avg) | Annual Net Profit |
|---|---|---|---|
| Quick-Service (QSR) | 6% – 9% | $850,000 | $51,000 – $76,500 |
| Fast-Casual | 5% – 8% | $1,100,000 | $55,000 – $88,000 |
| Casual Dining (FSR) | 3% – 6% | $1,400,000 | $42,000 – $84,000 |
| Fine Dining | 5% – 10% | $2,200,000 | $110,000 – $220,000 |
| Pizza / Delivery | 8% – 12% | $750,000 | $60,000 – $90,000 |
| Coffee / Bakery | 5% – 10% | $480,000 | $24,000 – $48,000 |
| Bar / Nightclub | 10% – 15% | $600,000 | $60,000 – $90,000 |
Notice something? Bars and pizza shops often outperform fine dining restaurants on margin percentage. The reason is simple: lower labor costs per revenue dollar and higher-margin products (alcohol, delivery-focused menus).
But it gets worse: if your casual dining restaurant is running a 3% margin and you think that's normal, you might be right — for the average. But the top quartile of casual dining operators runs 6% to 8%. That gap, on $1.4 million in revenue, is $42,000 to $70,000 per year.
Where does your restaurant fall?
Food Cost: The Benchmark Everyone Knows (and Most Get Wrong)
Food cost percentage is the metric every restaurant owner tracks. But here's what most get wrong: they track it monthly from invoices, not weekly from actual usage. That means they don't catch cost creep until the P&L arrives — three to four weeks too late.
| Restaurant Type | Target Food Cost % | Warning Zone | Crisis Zone |
|---|---|---|---|
| Quick-Service | 25% – 30% | 31% – 34% | 35%+ |
| Fast-Casual | 28% – 32% | 33% – 36% | 37%+ |
| Casual Dining | 30% – 35% | 36% – 38% | 39%+ |
| Fine Dining | 30% – 35% | 36% – 39% | 40%+ |
| Steakhouse / Seafood | 35% – 40% | 41% – 43% | 44%+ |
| Pizza | 24% – 28% | 29% – 32% | 33%+ |
| Coffee / Bakery | 22% – 28% | 29% – 32% | 33%+ |
If you're in the warning zone, you're not in trouble yet — but you're eroding profit every week you don't act. The most common culprits: portion drift (cooks gradually increasing serving sizes), untracked waste, supplier price increases that nobody renegotiated, and theft.
Here's the thing: a POS system with integrated inventory tracking catches all four. When every item sold automatically decrements inventory, and your actual usage is compared against theoretical usage daily, you see the variance in real time. That's the difference between managing food cost and simply measuring it after the damage is done.
At KwickOS, our inventory module tracks real-time usage against POS sales data. Operators like T. Jin China Diner — managing 15 stores and 75 terminals — use this to monitor food cost across every location from a single dashboard, catching variance before it becomes a monthly surprise.
Labor Cost: The Line Item That's Growing Fastest
Labor cost is now the largest controllable expense for most restaurants, surpassing food cost in many markets due to minimum wage increases and competitive hiring pressure. Here are the 2026 benchmarks:
| Restaurant Type | Target Labor Cost % | Includes |
|---|---|---|
| Quick-Service | 25% – 30% | Wages, taxes, benefits, insurance |
| Fast-Casual | 26% – 32% | Wages, taxes, benefits, insurance |
| Casual Dining | 28% – 35% | Wages, taxes, benefits, insurance |
| Fine Dining | 30% – 36% | Wages, taxes, benefits, insurance |
And that's not all: the operators beating these benchmarks aren't cutting staff or paying less. They're using technology to make each labor hour more productive. Self-ordering kiosks that handle routine orders. Kitchen display systems that eliminate verbal miscommunication. Scheduling software that matches staffing levels to historical traffic patterns instead of gut-feel guesses.
Rockin' Rolls Sushi Express deployed 49 iPad self-ordering stations across 3 locations and reduced front-of-house labor needs by 30% — without cutting a single server. They redeployed staff to hospitality-focused roles that increased tip averages and customer satisfaction.
KwickOS fingerprint authentication also eliminates time theft — a problem that, according to industry research, costs the average restaurant $5,000 to $10,000 per year. When employees clock in and out with their fingerprint (1:N matching, not a PIN that can be shared), buddy punching disappears overnight.
Prime Cost: The One Metric That Predicts Everything
If you only track one number, make it prime cost. Prime cost = food cost + beverage cost + total labor cost (wages, taxes, benefits, insurance). It represents the two largest controllable expenses in your restaurant, combined.
The benchmark: 60% to 65% of revenue.
Here's why this number matters more than any individual metric: food cost and labor cost have an inverse relationship. A steakhouse might run 38% food cost but only 28% labor cost (prime cost: 66%). A sushi restaurant might run 30% food cost but 34% labor cost (prime cost: 64%). Both are healthy, but only prime cost tells you that.
| Prime Cost Range | What It Means | Action |
|---|---|---|
| Under 55% | Excellent — top-tier profitability | Maintain, invest in growth |
| 55% – 60% | Strong — above average | Fine-tune, protect margins |
| 60% – 65% | Healthy — industry standard | Monitor weekly, look for improvements |
| 65% – 70% | Warning — profit is thin | Immediate cost review needed |
| Over 70% | Crisis — losing money or breaking even | Emergency intervention required |
A 2% reduction in prime cost on a $1.2 million restaurant adds $24,000 straight to the bottom line. That single improvement could double net profit for a restaurant running at 4% margin.
But it gets worse: most restaurants don't calculate prime cost weekly. They find out 30 to 45 days after the fact when their accountant delivers the P&L. By then, the money is gone.
This is where your POS system either helps or fails you. A system with real-time labor and inventory reporting lets you see prime cost today — not next month. KwickOS's hybrid local+cloud architecture means this data is available even when your internet drops, with 1ms local response times. When the connection comes back, everything syncs automatically.
Rent and Occupancy: The Fixed Cost That Breaks Restaurants
Rent is the one major cost you can't negotiate down after signing the lease. That makes it the most dangerous number on your P&L.
The benchmark: 6% to 10% of gross revenue.
- Under 6%: Excellent position. You have room to absorb cost fluctuations.
- 6% to 8%: Healthy range. Most profitable restaurants fall here.
- 8% to 10%: Manageable but tight. Food and labor cost control must be exceptional.
- Over 10%: Dangerous. Profitability becomes extremely difficult regardless of operational efficiency.
Total occupancy cost (rent + CAM + insurance + property taxes) should stay under 12% of revenue. If your occupancy cost exceeds 12%, you need to either increase revenue significantly or consider renegotiating your lease at renewal.
Here's the thing: many restaurant owners sign leases based on projected revenue — the optimistic scenario. Then when reality delivers 70% of the projection, rent is suddenly 13% of revenue instead of the planned 8%, and the math simply doesn't work.
Before signing any lease, use a restaurant lease calculator to model worst-case, expected, and best-case revenue scenarios. If rent exceeds 10% at your expected revenue, the location is too expensive.
Revenue Per Seat: Are You Getting Enough From Your Space?
Revenue per seat is one of the most underused metrics in the restaurant industry. It tells you whether your physical space is generating enough revenue to justify its cost.
| Restaurant Type | Revenue Per Seat / Year | Top Quartile |
|---|---|---|
| Quick-Service | $15,000 – $22,000 | $25,000+ |
| Casual Dining | $18,000 – $28,000 | $32,000+ |
| Fine Dining | $30,000 – $55,000 | $60,000+ |
| Fast-Casual | $12,000 – $20,000 | $24,000+ |
To increase revenue per seat, focus on three levers: check average (menu pricing, upselling, and modifiers), seat turnover (faster table turns without rushing guests), and operating hours (adding dayparts like breakfast or late-night).
This is where gift cards and loyalty programs create a measurable revenue lift. Industry data shows that customers redeeming gift cards spend 20% to 40% above the card value on average. A digital gift card and e-gift card program integrated into your POS doesn't just generate upfront cash — it drives higher-spending visits.
Similarly, a loyalty and membership program increases visit frequency by 18% to 25% according to restaurant industry data. Points-based programs where customers earn rewards toward free items, combined with tier-based perks for your best customers, compound over time. KwickOS's built-in CRM tracks every loyalty member's lifetime value, visit frequency, and average spend — data that lets you make smarter decisions about where to invest marketing dollars.
The Hidden Profit Killers Most Owners Miss
Beyond the headline metrics, several less-obvious costs erode profitability. Here's where to look:
Payment Processing Fees: 2.2% to 3.5% of Revenue
Processing fees are the silent tax on every transaction. On $1 million in annual card sales, the difference between a 2.3% effective rate and a 2.9% rate is $6,000 per year. Most POS systems lock you into their proprietary processor at non-negotiable rates.
KwickOS is processor-agnostic — you choose any payment processor and negotiate your own rate. Our merchants typically save $3,000 to $8,000 per year compared to locked systems like Toast or Square. That's money that drops straight to net profit. Use our processing fee calculator to see your potential savings.
Third-Party Delivery Commissions: 15% to 30% Per Order
If 20% of your revenue comes through DoorDash or UberEats at a 25% commission, you're paying $50,000 to $75,000 per year on a $1 million restaurant. KwickDriver charges a flat $2 + $6.99 per delivery instead of a percentage — at the same volume, that's roughly $15,000 per year. The savings: $35,000 to $60,000.
Comps, Voids, and Discounts: 1% to 3% of Revenue
Untracked comps and excessive discounting erode revenue invisibly. Industry research suggests that the average restaurant gives away 1.5% to 2.5% of revenue through comps, voids, and employee discounts. A POS that tracks every comp by employee, requires manager authorization for voids, and reports discount trends weekly keeps this under control.
How Top-Performing Restaurants Use Their POS to Protect Margins
The difference between a 4% margin and an 8% margin rarely comes from one big change. It comes from dozens of small improvements, monitored weekly and compounded over time. Here's what top operators do differently:
- Weekly prime cost calculation — not monthly. Real-time POS inventory and labor data makes this possible without manual spreadsheets.
- Daily sales mix analysis — tracking which items sell and which sit, then adjusting menus monthly based on data rather than intuition.
- Labor scheduling by historical traffic — matching staffing to 15-minute sales intervals, not day-of-week averages.
- Automatic low-stock alerts — preventing both 86'd items (lost revenue) and over-ordering (waste).
- Gift card and e-gift card promotion — driving prepaid revenue during slow periods and holidays. KwickOS supports both physical and digital gift cards with instant activation at checkout.
- Loyalty program optimization — using visit frequency and spend data to create targeted promotions that bring the right customers back more often.
Crafty Crab Seafood runs 19 locations with 152 terminals on KwickOS. They use centralized reporting to compare prime cost, labor efficiency, and food cost across every store — and the managers who fall outside benchmarks hear about it the same week, not at a monthly meeting when it's too late.
Diva Nail Beauty uses KwickOS's automated commission tracking across 4 stores and increased operational efficiency by 90%. Their managers spend minutes on payroll, not hours — freeing time for customer experience and revenue growth.
Your Profitability Scorecard
Pull your most recent P&L and fill in your numbers. Then compare them to the benchmarks in this article:
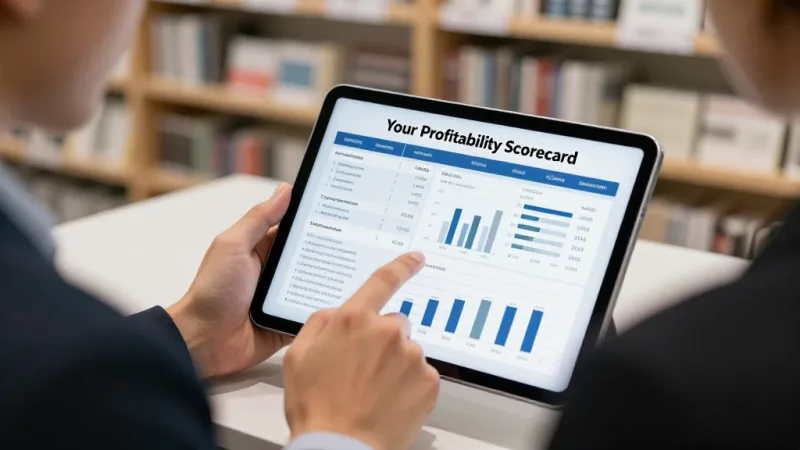
| Metric | Your Number | Benchmark | Status |
|---|---|---|---|
| Net Profit Margin | _____% | 5% – 8% | |
| Food Cost % | _____% | 28% – 35% | |
| Labor Cost % | _____% | 25% – 35% | |
| Prime Cost % | _____% | 60% – 65% | |
| Rent / Occupancy % | _____% | 6% – 10% | |
| Revenue Per Seat | $_____ | See table above | |
| Processing Fee Rate | _____% | 2.1% – 2.4% |
If two or more metrics fall outside the benchmark range, you're leaving significant money on the table. And every month you wait is another month of lost profit that you can never recover.
Want to calculate your exact profitability position? Try our restaurant profit margin calculator — input your revenue, costs, and expenses, and get a complete profitability breakdown with benchmarks for your restaurant type.
Know Your Numbers. Protect Your Profit.
KwickOS gives you real-time visibility into every metric that matters — food cost, labor, prime cost, processing fees, and more. Across 5,000+ businesses in 50 states, operators use KwickOS to monitor profitability daily, not monthly.
See How KwickOS Tracks Your Margins