 Tom Jin
A family of four walks into your restaurant on a Friday night. The host squints at the floor chart, mentally counts the tables that look close to finishing, and says: "About 25 minutes."
The family sits down in the waiting area. Thirty-eight minutes later, they're still there. The father checks his phone. A Yelp search for "restaurants near me open now" is already loaded.
They leave.
Here's the thing: that family was going to spend $127. You know that because your POS data says Friday-night four-tops average $127.43. But your host's wait time estimate was off by 13 minutes, and according to industry research, 30% of guests who wait longer than the quoted time will leave without being seated.
Now multiply that by every Friday and Saturday night for a year. That is not a minor inconvenience. That is $15,000 to $40,000 in annual walkaway revenue — and it happens because humans are terrible at estimating wait times under pressure.
But it gets worse: the walkaway problem is just one symptom. The real disease is that most restaurants operate blind. You don't know how many people are in your lobby right now. You don't know which tables have been empty for six minutes while the busser chats in the kitchen. You don't know that your drive-thru line backed up at 12:07 and you lost 14 cars between 12:07 and 12:35.
Computer vision fixes all of it. Not someday — now. And the cost is less than one month of the revenue you're already losing.
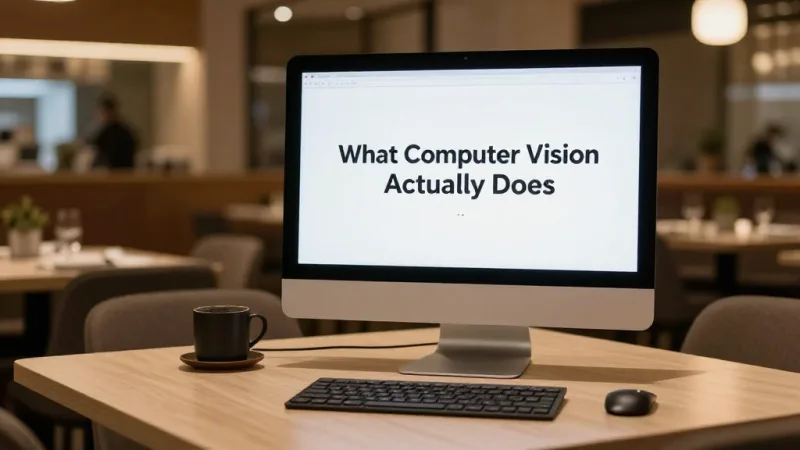
What Computer Vision Actually Does in a Restaurant
Computer vision is AI that watches camera feeds and extracts structured data in real time. No human needs to monitor the screens. The system counts, measures, and reports automatically.
In a restaurant context, here are the five applications that matter most:
1. People Counting and Foot Traffic
An overhead camera at your entrance counts every person who walks in and walks out. You get hourly, daily, and weekly foot traffic charts — broken down by time of day — pushed directly into your analytics dashboard.
Why it matters: when you know that 347 people entered on Tuesday but only 291 transactions hit the POS, you know your conversion rate is 83.9%. That missing 16.1% represents people who walked in, looked around, and left. Now you can investigate why — was the wait too long? Was the lobby too crowded? Did you run out of a menu item?
And that's not all: foot traffic data also tells you exactly when to schedule staff. Not based on "we're usually busy on Fridays" but based on six months of camera data showing that your door count spikes at 11:42 AM on weekdays and 6:18 PM on weekends. KwickOS scheduling can pull this data directly to auto-generate shift recommendations.
2. Wait Time Estimation
This is the application that pays for itself fastest. A camera watching the lobby or queue area counts the number of waiting parties, tracks how long each has been waiting, and correlates that with your average table turnover rate from POS data.
Instead of your host guessing "about 25 minutes," a screen behind the host stand displays: Estimated wait: 18 minutes (based on 4 parties ahead, current turnover: 47 min avg).
Restaurants using camera-based wait estimation report that quoted accuracy improves from within-15-minutes to within-3-minutes. The result is simple: fewer walkaways, higher guest satisfaction, and better Google reviews (wait time complaints are among the top three reasons for one-star reviews).
3. Table Occupancy Detection
Overhead cameras positioned above the dining room detect which tables are occupied, which are empty, and which are in the "dirty but cleared" state. The data feeds into a live floor map that updates every few seconds.
Here's where it gets interesting. When the system detects that table 14 has been empty for more than four minutes after the guests stood up, it can automatically alert the busser's handheld device. When the table is cleaned and reset, the camera detects the change and marks it available on the host's seating chart.
For a 120-seat restaurant with 52-minute average table time, reducing the "dirty table dwell time" from 8 minutes to 3 minutes adds roughly one extra turn per table per night during peak hours. At your Friday night average of $31.80 per person, that's $127 per four-top per extra turn. Across 15 four-tops on a Friday night, that is $1,905 in additional revenue per week — from tables that were already there, just sitting empty five minutes too long.
4. Drive-Thru Analytics
If you operate a QSR or fast-casual with a drive-thru, computer vision is transformative. Cameras track vehicles from the moment they enter the lane to the moment they leave the pickup window. You get:
- Average time in lane — broken down by order point, payment window, and pickup window
- Queue abandonment — how many cars see the line, decide it's too long, and drive away
- Throughput per hour — how many vehicles you're actually serving vs. your theoretical maximum
- Bottleneck identification — whether the delay is at ordering, payment, or food assembly
According to restaurant industry data, the average drive-thru loses 5-8% of potential customers to queue abandonment during peak hours. For a location doing $15,000/week in drive-thru sales, that is $750 to $1,200/week in revenue driving away — literally.
5. Heat Mapping and Traffic Flow
Heat maps show where customers spend the most time inside your restaurant. For quick-service and fast-casual concepts, this reveals whether customers are getting stuck at the condiment station, bunching up at the ordering counter, or bypassing your retail display entirely.
For restaurants that sell gift cards and branded merchandise at a front display, heat map data tells you whether customers even look at that display — and if repositioning it closer to the exit (where 73% of impulse purchases happen, according to retail industry data) could increase sales.
The Real Numbers: What Computer Vision Costs vs. What It Returns
Let's stop talking in abstractions and lay out the actual math.
Hardware and Software Costs
| Component | Cost Range | Notes |
|---|---|---|
| IP cameras (2-4 units) | $400 - $1,600 | PoE cameras with wide-angle lens, 1080p minimum |
| Edge computing device | $500 - $2,000 | Processes video locally, no cloud dependency |
| Installation | $500 - $1,200 | Mounting, cabling, calibration |
| Software/analytics (monthly) | $100 - $300/mo | Dashboard, alerts, POS integration |
Total first-year cost: $3,600 - $8,400 (hardware + 12 months of software).
Revenue Impact
| Improvement Area | Conservative Annual Gain |
|---|---|
| Reduced walkaways (better wait estimates) | $15,000 - $25,000 |
| Faster table turns (occupancy alerts) | $12,000 - $20,000 |
| Optimized labor scheduling | $5,000 - $10,000 |
| Reduced drive-thru abandonment | $8,000 - $15,000 (if applicable) |
Even using the lowest estimates and ignoring drive-thru: $32,000 in annual gains against $8,400 in costs. That is a 3.8x return in year one, improving to 10x+ in subsequent years when hardware is paid off.
But here's what makes it even more compelling: those gains compound. Better scheduling means lower labor cost percentage. Lower walkaways mean higher revenue per square foot. Higher table turns mean you can serve more loyalty program members during peak hours, driving repeat visits and building lifetime customer value. Every metric that matters moves in the right direction.
How Computer Vision Integrates With Your POS
Camera data in isolation is interesting. Camera data connected to your POS is actionable.
Here's what a fully integrated setup looks like:
- Foot traffic + sales data = conversion rate by hour, day, and season
- Table occupancy + ticket close times = true table turnover rate (not the estimate your manager carries in their head)
- Queue count + average ticket = real-time revenue-at-risk when the line gets too long
- Heat map + POS item sales = whether merchandising displays (gift card racks, branded items) are positioned where customers actually look
This is where your POS architecture matters enormously. A closed POS system with no API access — like standard Toast or Square plans — makes this integration difficult or impossible. You're stuck exporting CSV files and manually correlating data.
A platform with open API architecture, like KwickOS, lets the computer vision system push data directly into your reporting dashboard. The POS already knows your sales, labor costs, and loyalty and gift card redemption patterns. Adding camera data completes the picture.
And that's not all: because KwickOS runs on a hybrid local+cloud architecture, the edge computing device for your cameras can communicate with the POS over your local network at 1ms latency — no round trip to a remote server required. Table status updates hit the host stand instantly, not "within a few seconds."
Case Study: Multi-Location Visibility
Consider a multi-location operation like T. Jin China Diner, which runs 15 stores with 75 terminals. The owner needs to know, at any given moment, how each location is performing — not just in sales (which the POS already provides) but in operational efficiency.
With computer vision deployed across locations, a central dashboard shows:
- Which locations have wait times over 15 minutes right now
- Which locations have occupancy below 60% (potential candidates for delivery driver staging or early staff cuts)
- Which locations consistently have the slowest table-clear times (identifying training opportunities)
- Which locations have the highest walkaway rates (indicating potential issues with host staffing or lobby size)
This isn't theoretical. This is the kind of operational intelligence that separates a 15-store chain running smoothly from a 15-store chain where the owner is constantly putting out fires they didn't see coming.
Similarly, Crafty Crab Seafood — 19 stores, 152 terminals — uses centralized menu sync through KwickOS to update all locations in one click. Adding computer vision to that infrastructure means operational metrics flow through the same dashboard, giving operators a unified view of every dimension of their business.
Privacy: What You Need to Know
The number-one objection restaurant owners raise about computer vision is privacy. It's a legitimate concern, and here's the straight answer:
Modern restaurant CV systems do not use facial recognition. They detect anonymous silhouettes, count bodies, and measure dwell times. The video is processed on the edge device inside your restaurant and is never uploaded to the cloud. No identifiable images are stored.
Here's the thing: you almost certainly already have security cameras in your restaurant. Computer vision uses the same cameras (or shares the feed) but extracts structured data instead of recording footage for playback. In most jurisdictions, the same "security cameras in use" signage that covers your existing cameras covers the CV system as well.
That said, best practices include:
- Posting clear signage that video analytics are in use
- Using overhead angles (which naturally obscure faces) rather than eye-level cameras
- Choosing vendors that process everything locally with no cloud video storage
- Reviewing your state's specific privacy regulations (Illinois BIPA, California CCPA, etc.)
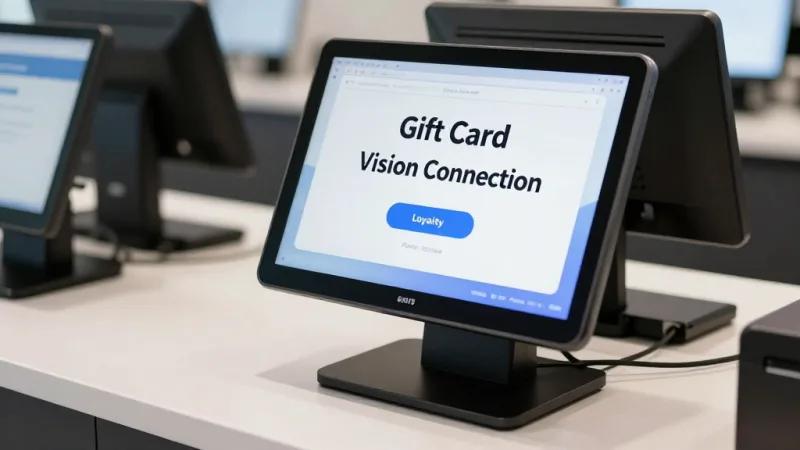
Gift Cards, Loyalty, and the Computer Vision Connection
This might seem like an unexpected connection, but computer vision data makes your gift card and loyalty programs significantly more effective.
Here's how:
Gift card display optimization. If your heat map shows that 80% of customers walk past your gift card display without stopping, you know to move it. Repositioning a gift card rack from the entry wall to the checkout counter (where customers stand idle for 30-90 seconds) can increase gift card sales by 2-3x during the holiday season, according to restaurant industry data. For a restaurant doing $8,000/year in gift card revenue, that's potentially $16,000 to $24,000 with a simple shelf move validated by camera data.
Loyalty enrollment timing. Computer vision can detect when the checkout queue is short (under 2 people waiting), which is the optimal time for cashiers to spend 30 seconds pitching the loyalty program. When the queue is 5 deep, skip the pitch — speed matters more. POS-triggered prompts can be conditioned on real-time camera data: show the "Ask about loyalty" prompt on the cashier screen only when the line is short.
E-gift card kiosk placement. If you have a self-service kiosk that sells e-gift cards (a growing trend for quick-service), heat map data tells you exactly where in the lobby to place it for maximum engagement. Near the exit? Near the waiting area? The camera data removes the guesswork.
Getting Started: A Practical Roadmap
You don't need to deploy cameras everywhere on day one. Here's a phased approach:
Phase 1: Entrance counter + wait area (Month 1)
- Install one overhead camera at the entrance for foot traffic counting
- Install one camera covering the waiting area for queue tracking
- Connect to POS for conversion rate reporting
- Cost: $1,500 - $3,000 hardware + $100 - $200/mo software
Phase 2: Dining room occupancy (Month 3)
- Add 1-2 overhead cameras covering the dining floor
- Enable table occupancy detection and busser alerts
- Measure table turn improvement
- Cost: $800 - $1,500 additional hardware
Phase 3: Full analytics (Month 6)
- Enable heat mapping for traffic flow analysis
- Add drive-thru cameras if applicable
- Integrate with labor scheduling for automated shift recommendations
- Cost: $500 - $1,000 additional hardware
Total investment over six months: $3,000 - $6,500 plus $100 - $300/mo in software. By month 6, you should have clear data on whether the system is paying for itself — and based on the numbers above, it almost certainly will.
What to Look For in a Computer Vision Vendor
Not all CV platforms are built for restaurants. Here are the non-negotiable requirements:
- Edge processing. Video should be analyzed locally, not streamed to the cloud. This protects privacy, eliminates bandwidth costs, and ensures the system works even if your internet drops. (Sound familiar? It's the same hybrid local+cloud philosophy that makes KwickOS resilient.)
- POS integration via API. If the CV system can't talk to your POS, you're just generating charts nobody looks at. Insist on API-level integration with your specific POS platform.
- Restaurant-specific models. Generic "people counting" AI trained on retail stores performs poorly in restaurants where people sit for 45 minutes. You need models trained on restaurant environments — seated vs. standing, party sizes, table states.
- Actionable alerts, not just dashboards. The system should send push notifications when wait times exceed thresholds, when tables sit dirty too long, or when foot traffic spikes unexpectedly. A dashboard nobody checks is a dashboard that doesn't exist.
- No long-term contract. The technology is evolving fast. Lock into a 3-year contract and you'll miss better solutions. Aim for month-to-month software with owned hardware.
The Bottom Line
Restaurants generate enormous amounts of visual data every day — people entering, people waiting, tables turning, lines forming. Until now, that data has been invisible. A host's gut feeling, a manager's glance at the dining room, a shift lead's estimate of how busy the drive-thru got.

Computer vision converts invisible data into numbers. Numbers you can act on. Numbers that show up in your revenue calculations, your labor cost percentages, and your guest satisfaction scores.
The technology is no longer experimental. The hardware costs less than one bad Saturday night of walkaways. And for multi-location operators already running on a platform like KwickOS — where centralized management, open APIs, and local processing are built in — adding computer vision is less a technology project and more a natural extension of the data you're already collecting.
Your cameras are probably already there. The question is whether they're just recording footage nobody watches — or turning every frame into revenue.
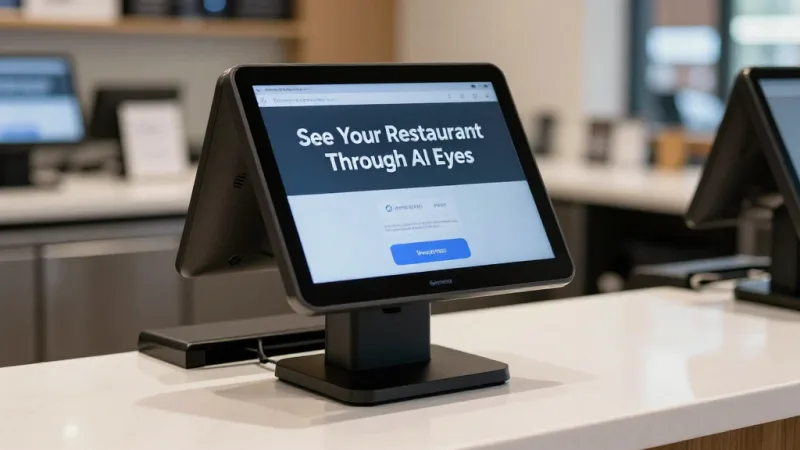
See Your Restaurant Through AI Eyes
KwickOS integrates with leading computer vision platforms through open APIs — giving you foot traffic, wait times, and occupancy data right in your POS dashboard.
Request a Demo