 Ming Ye
You probably know your food cost percentage. You probably know your labor cost. You might even know your average check size down to the penny.
But do you know how much revenue every square foot of your restaurant generates?
If the answer is no, you're flying blind on the single metric that landlords, investors, and the most profitable operators in the industry use to predict whether a restaurant will thrive or slowly bleed out.
Here's the thing: your rent doesn't care whether a square foot is a dining chair, a walk-in cooler, or a hallway nobody uses. Every square foot costs you the same amount — but not every square foot earns you the same amount. And that gap between what you're paying and what you're earning per square foot is either making your restaurant profitable or quietly destroying it.
According to restaurant industry data, the average full-service restaurant generates between $300 and $500 per square foot annually. The top performers push $600 to $800+. The ones that close within two years? Most of them never broke $250.
This guide will show you exactly how to calculate your revenue per square foot (RevPSF), what the benchmarks look like by restaurant type, and — most importantly — the specific operational changes that move this number in the right direction. We'll use real math, not vague advice.
What Revenue Per Square Foot Actually Tells You
Revenue per square foot is the simplest and most brutal efficiency metric in the restaurant business. It answers one question: is this space earning its keep?
The formula is straightforward:
RevPSF = Annual Revenue ÷ Total Occupied Square Footage
Total occupied square footage means everything you're paying rent on — dining room, kitchen, bar, storage, restrooms, hallways, host stand, all of it. You can't exclude the kitchen just because it doesn't seat customers. You're paying for that space, so it needs to justify its existence.
Let's run a quick example. A 2,500 sq ft restaurant generating $1.2 million in annual revenue:
$1,200,000 ÷ 2,500 = $480/sq ft
That's solid — above average for full-service dining. But it gets worse when you break it down by zone.
| Zone | Sq Ft | % of Space | Revenue Contribution | RevPSF |
|---|---|---|---|---|
| Dining Room | 1,200 | 48% | $780,000 | $650 |
| Bar Area | 400 | 16% | $300,000 | $750 |
| Kitchen | 500 | 20% | $0 (supports all) | — |
| Storage/Utility | 250 | 10% | $0 | — |
| Restrooms/Hallway | 150 | 6% | $0 | — |
Notice that? The bar — just 16% of total space — generates 25% of revenue and has the highest RevPSF at $750. The dining room, which takes up nearly half the restaurant, lags behind at $650. And 36% of the total space generates zero direct revenue.
That's not necessarily bad — you need a kitchen and restrooms. But it means your revenue-generating space has to work even harder to cover the cost of the non-revenue space.
And that's not all: this math shifts dramatically depending on your restaurant format.
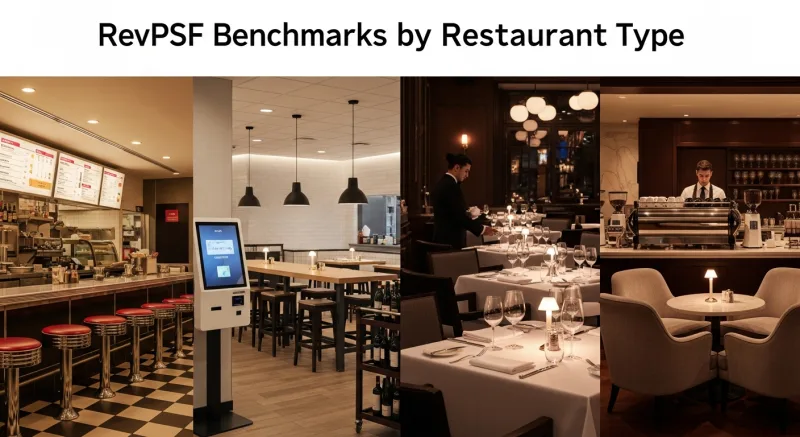
RevPSF Benchmarks by Restaurant Type
Not all restaurants are built the same. A QSR counter-service spot has completely different space economics than a fine dining room with 8-foot table spacing. Here are the benchmarks you should compare against:
| Restaurant Type | Typical Size | Average RevPSF | Top 10% RevPSF |
|---|---|---|---|
| QSR / Fast Food | 1,200-2,000 sq ft | $500-$700 | $900+ |
| Fast Casual | 1,800-3,000 sq ft | $450-$650 | $800+ |
| Full-Service Casual | 2,500-5,000 sq ft | $300-$500 | $650+ |
| Fine Dining | 3,000-6,000 sq ft | $400-$700 | $900+ |
| Bar / Nightclub | 1,500-4,000 sq ft | $600-$900 | $1,200+ |
| Coffee Shop | 800-1,500 sq ft | $400-$600 | $750+ |
| Bubble Tea Shop | 500-1,200 sq ft | $500-$800 | $1,000+ |
The pattern is clear: smaller footprints with high-margin products and fast turns win the RevPSF game. A 700 sq ft bubble tea shop doing $500,000/year generates $714/sq ft. A 4,000 sq ft casual dining restaurant needs to do $2.8 million just to match that efficiency.
But it gets worse if you're paying premium rent. In a market where commercial restaurant space goes for $50-$80/sq ft annually, your RevPSF needs to be at least 6-8x your rent cost to maintain healthy margins. A restaurant paying $60/sq ft in rent with a RevPSF of $300 is spending 20% of revenue on occupancy alone — well above the 6-10% industry target.
The 7 Levers That Move Revenue Per Square Foot
RevPSF is a function of two things: how much revenue you generate, and how efficiently your space supports that revenue. Here are the seven levers that matter most.
1. Table Turn Rate — The Multiplier Most Operators Ignore
Every empty seat during operating hours is lost revenue you can never recover. A 60-seat restaurant running 1.5 turns at dinner generates revenue from 90 covers. The same restaurant running 2.2 turns generates revenue from 132 covers. That's 47% more revenue from the exact same square footage.
Here's where your POS system becomes the bottleneck — or the accelerator. A cloud-only POS that takes 200ms to process each order input adds up across hundreds of transactions. KwickOS runs on a hybrid local+cloud architecture with 1ms local processing, meaning order entry, payment processing, and kitchen routing happen almost instantly. Across a full dinner service with 300+ transactions, those milliseconds compound into minutes — and minutes translate directly into faster table turns.
The Shogun Japanese Hibachi case illustrates this perfectly. With customized station displays and a POS system that new operators master in under 5 minutes, they cut order-to-kitchen time dramatically. When your kitchen display system shows exactly what each station needs to fire — no confusion, no verbal miscommunication — food comes out faster and tables turn sooner.
2. Revenue Beyond Four Walls — Online Ordering and Delivery
Here's a pattern interrupt that changes the math entirely: online ordering generates revenue with zero additional square footage.
A restaurant doing $80,000/month in dine-in from 3,000 sq ft has a RevPSF of $320. Add $25,000/month in online ordering through KwickMenu, and suddenly it's $420/sq ft — a 31% increase without leasing a single extra square foot.
But it gets worse if you're using third-party delivery apps. DoorDash and UberEats charge 15-25% commissions, which means a significant chunk of that "extra" revenue disappears before it helps your RevPSF. KwickDriver charges a flat $2 + $6.99 per delivery within 5 miles, keeping far more of each order's revenue in your pocket.
T. Jin China Diner runs 15 locations with 75 terminals and manages online ordering centrally across all of them. That centralized control means menu updates, pricing changes, and promotion launches happen once and deploy everywhere — no wasted labor hours that indirectly drag down RevPSF through inflated operating costs.
3. Bar Program — Your Highest RevPSF Zone
Look at the zone breakdown table above one more time. The bar generates $750/sq ft compared to $650 for the dining room. According to industry data, bar seats generate 2-3x more revenue per square foot than dining seats across the industry.
Why? Three reasons:
- Faster turns. A bar customer ordering two cocktails occupies a seat for 45 minutes. A dining customer takes 60-90 minutes.
- Higher margins. Drink margins run 75-85% compared to 65-70% for food. Every dollar of bar revenue is more profitable.
- Smaller footprint per seat. Bar stools require 2-3 sq ft each vs 15-18 sq ft per dining seat (including table and aisle space).
If your bar area is undersized relative to your dining room, you're leaving RevPSF on the table. Some operators have increased overall RevPSF by 15-20% simply by converting 200 sq ft of underperforming dining space into additional bar seating.
4. Self-Ordering Kiosks — Remove the Counter, Add Revenue
Traditional counter service requires a dedicated ordering station — usually 50-80 sq ft of counter, register, and queue space. Replace it with two self-ordering kiosks on 15 sq ft of floor space, and you've freed up 35-65 sq ft for revenue-generating use.
But the real RevPSF boost from kiosks isn't the space savings — it's the larger average tickets. Industry data consistently shows kiosk orders run 15-25% higher than counter orders because customers add more modifiers, accept more upsell prompts, and feel less rushed when nobody's watching.
Rockin' Rolls Sushi Express operates 49 iPad self-ordering stations across 3 locations. By removing traditional counter ordering entirely, they freed up front-of-house space while simultaneously increasing average order size. That's the RevPSF double play: less space consumed plus more revenue generated.
Tiger Sugar uses 2 self-service kiosks designed with minimal steps for maximum personalization — sweetness level, ice level, toppings — all without requiring a single staff member at a counter. The physical space those kiosks occupy is a fraction of what a traditional ordering counter would need.
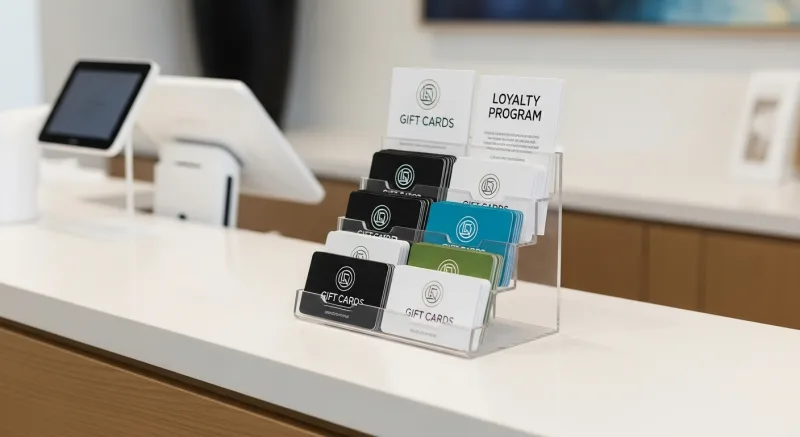
5. Gift Cards and E-Gift Cards — Revenue with Zero Space
Gift card sales are the ultimate RevPSF booster because they require essentially zero dedicated space. A small gift card display rack occupies maybe 1 sq ft of counter space. An e-gift card program on your website and social channels? Zero physical space.
And the numbers are meaningful. According to restaurant industry data, a well-promoted gift card program generates 3-7% of a restaurant's total revenue. For a $1.2 million restaurant, that's $36,000-$84,000 in gift card sales — revenue generated from approximately 1 square foot of display space.
But it gets better. Industry research shows approximately 15% of gift card value is never redeemed (breakage), and customers who redeem gift cards typically spend 20-40% above the card's face value. So a $50 gift card actually generates $60-$70 in total spending, with $7.50 in pure breakage revenue on top.
Your POS system needs to handle both physical and digital gift cards seamlessly. KwickOS manages gift card sales, redemption, balance tracking, and e-gift card distribution as part of the checkout flow — no separate system, no extra counter space for a dedicated gift card terminal.
6. Loyalty Programs and Memberships — Frequency Drives RevPSF
RevPSF isn't just about getting more out of each visit. It's about getting more visits, period. A loyalty program that increases visit frequency from 2x/month to 3x/month effectively boosts your RevPSF by 50% — same space, 50% more covers.
The most effective loyalty programs are integrated directly into the POS checkout flow. When earning and redeeming points requires zero extra steps — the system automatically tracks everything through a phone number or fingerprint at checkout — participation rates climb above 40%. Bolted-on third-party loyalty apps that require separate sign-ups and QR code scans? Participation rates under 15%.
KwickOS integrates loyalty, membership, and points tracking directly into the checkout process. Customers earn points automatically. Birthday rewards trigger automatically. Tier upgrades happen automatically. The less friction in the system, the more customers engage — and the more frequently they visit your revenue-generating space.
Consider layering a membership program on top. A coffee shop charging $29/month for unlimited drip coffee doesn't just generate predictable recurring revenue — it drives those members into the store daily, where they add pastries, sandwiches, and specialty drinks at full margin. That's RevPSF compounding through frequency.
7. Dayparting — Make Dead Hours Earn
Most restaurants operate at peak efficiency for only 4-5 hours per day. The rest of the time? Your expensive square footage sits underutilized.
Dayparting strategy attacks this directly. A casual dining restaurant that opens at 5 PM is generating $0/sq ft for the entire morning and afternoon. Add a lunch service, and you've potentially doubled your RevPSF without adding a single square foot.
Crafty Crab Seafood demonstrates how multi-location operators can deploy menu changes rapidly. With 19 stores and 152 terminals, they use one-click menu sync to roll out lunch specials, happy hour pricing, or late-night menus across every location simultaneously. That operational speed makes dayparting practical at scale — you're not asking 19 managers to manually update menus four times a day.
The Space Allocation Playbook
Industry research suggests the most RevPSF-efficient restaurants share a common space allocation pattern:
| Zone | % of Total Space | RevPSF Optimization Target |
|---|---|---|
| Dining Room + Bar | 55-65% | Revenue-generating; maximize seat count and turn rate |
| Kitchen + Prep | 25-35% | Revenue-supporting; optimize layout for speed |
| Storage + Utility | 5-10% | Minimize through just-in-time delivery and vertical storage |
| Restrooms + Hallways | 5-8% | Code minimum; keep functional but compact |
If your kitchen exceeds 35% of total space, you're likely over-allocated. Modern kitchen design with the right KDS routing can reduce kitchen footprint by 10-15% through better station layout, elimination of paper ticket rails, and streamlined expo workflows.
Here's the thing: reducing your kitchen by even 50 sq ft and converting it to two additional two-tops could add $30,000-$50,000 in annual revenue. At $60/sq ft rent, those 50 sq ft cost you $3,000/year. If they generate $40,000 in revenue, that's a 13:1 return on space.
How Your POS System Impacts RevPSF
Your POS system touches every lever we've discussed. Checkout speed affects table turns. Online ordering integration affects revenue beyond four walls. Gift card and loyalty features affect repeat visits. Reporting tells you which hours and zones underperform.
But there's a cost angle most operators miss. If your POS locks you into a specific payment processor at inflated rates, it's directly reducing the net revenue that each square foot generates. A restaurant processing $40,000/month through Toast's mandatory 2.99% + $0.15 pays roughly $4,768/year more than the same restaurant using interchange-plus pricing through a processor-agnostic system.
That $4,768 represents revenue that left your building without producing anything. In RevPSF terms, for a 2,500 sq ft restaurant, that's $1.91/sq ft in lost efficiency — just from processing fees. Use our processing fee calculator to see what your locked-in processor is costing you.
KwickOS is processor-agnostic, meaning you can negotiate your own processing rates and switch processors anytime. For operators who obsess over RevPSF — and the most successful ones do — saving $3,000-$8,000/year in processing fees is the equivalent of generating tens of thousands in additional revenue, given typical 5-10% restaurant margins.
Tracking RevPSF in Practice
Knowing your overall RevPSF is a starting point. Tracking it over time and by zone is where the real insights live.
Here's what the best operators track:
- Monthly RevPSF trend. Is it growing, flat, or declining? A declining trend — even while total revenue grows — usually means you've added space without proportional revenue (common after renovations).
- RevPSF by daypart. Your lunch RevPSF vs dinner RevPSF reveals which service drives more spatial efficiency. If lunch generates $180/sq ft and dinner generates $450/sq ft, you know where to focus expansion efforts.
- RevPSF by zone. Track bar vs dining room vs patio separately. This data drives space allocation decisions during renovations.
- Revenue per seat per hour (RevPASH). A complementary metric that captures both spatial and temporal efficiency. Divide hourly revenue by total seats to get RevPASH, then compare across hours and days.
KwickOS real-time reporting dashboards let you pull these numbers from your phone — at 2 AM, from your couch, across all locations. T. Jin China Diner uses this exact capability to monitor 15 locations remotely, spotting underperforming stores before small problems become large ones.
Diva Nail Beauty tracks a similar metric across their 4 stores — revenue per station per hour — which is the beauty industry equivalent of RevPSF. With KwickOS handling automated commission tracking (a process that improved their efficiency by 90%), their managers spend less time on payroll math and more time on optimizing how each station hour is used.
The Bottom Line on RevPSF
Revenue per square foot isn't just a number for your landlord or your investor. It's the most comprehensive single metric for operational efficiency in the restaurant business. It forces you to ask hard questions about every square foot you're paying for: Is this space earning its keep? Could it earn more? Should it even exist?
The restaurants that track RevPSF — and act on what it tells them — consistently outperform those that focus only on top-line revenue or food cost percentage. Because a restaurant can grow revenue by 20% and still become less efficient if it adds 40% more space to do it.
Start with the formula. Calculate your number. Compare it to the benchmarks. Then work through the seven levers — table turns, online ordering, bar program, kiosks, gift cards, loyalty, and dayparting — and identify which one moves the needle most for your specific operation.
Every square foot is either earning its rent or eating your profit. Now you know how to tell which is which.
Maximize Every Square Foot
KwickOS gives you real-time RevPSF tracking, integrated online ordering, gift cards, loyalty, and processor freedom — all in one platform. See how much more your space could earn.
Calculate Your RevPSF