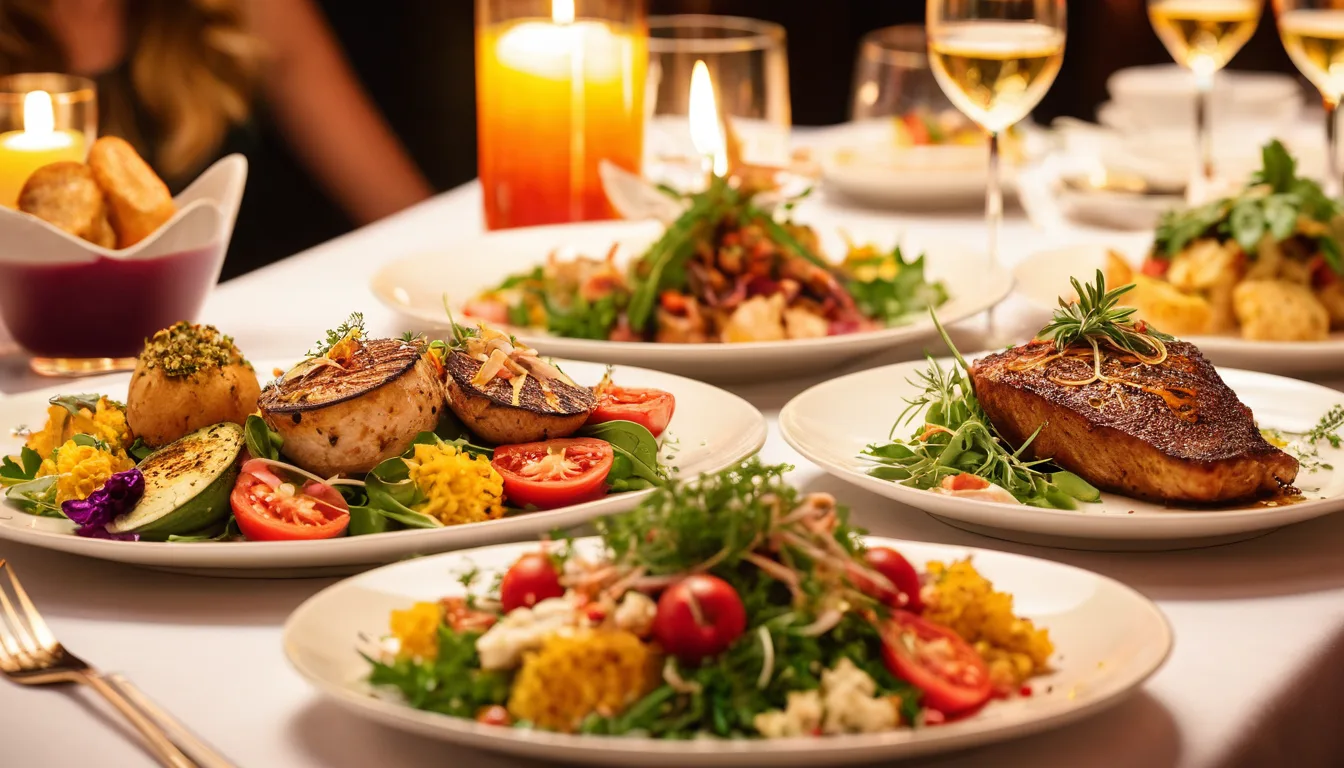
Most restaurant owners think of their menu as a list of food items with prices. Menu engineers think of it as a sales tool — one that guides customers toward high-profit items, creates a perception of value, and systematically increases the amount each guest spends. The science behind this has been studied extensively since the 1980s, when Cornell University researchers first published the menu engineering matrix that's still used in hospitality programs today.
The results speak for themselves. Restaurants that apply menu engineering principles consistently see average check increases of 12-18% without raising prices across the board, changing portion sizes, or adding expensive new items. They achieve this by understanding how customers read menus, how price presentation affects ordering decisions, and which items deserve the most visual real estate.
This guide covers the complete framework: classifying your menu items, applying pricing psychology, optimizing layout, writing descriptions that sell, and using your POS data to make it all measurable.
The Menu Engineering Matrix: Stars, Plowhorses, Puzzles, and Dogs
Every menu item falls into one of four categories based on two variables: popularity (how often it's ordered) and profitability (how much gross profit each sale generates). The original framework was developed by Michael Kasavana and Donald Smith at Michigan State University, and it remains the foundation of menu engineering.
| High Popularity | Low Popularity | |
|---|---|---|
| High Profitability | Stars | Puzzles |
| Low Profitability | Plowhorses | Dogs |
Stars: High Popularity + High Profitability
These are your best menu items. Customers love them and they generate strong margins. Examples might include a signature pasta dish that costs $4.50 to make and sells for $22, or a craft cocktail with $3 in ingredients priced at $16.
Strategy: Protect Stars. Don't change the recipe, don't hide them on the menu, and don't raise their price aggressively. Give them prime visual placement. If a Star starts losing popularity, investigate immediately — did a key ingredient change? Did you alter the portion? Stars are what your regulars come back for.
Plowhorses: High Popularity + Low Profitability
These items sell well but don't make you much money. The classic example is a half-pound burger with premium toppings priced at $14 with a $6.50 food cost — a 46% food cost on your most popular item. Customers love it, but it's dragging your overall food cost up.
Strategy: Improve profitability without killing popularity. Options include: slightly reducing portion size (customers rarely notice a 10% reduction in fries), substituting a cheaper side as the default, increasing the price by $1-2 (test carefully), or engineering an upsell — "Add bacon and cheddar for $3" turns your $7.50 gross profit into $10.20.
Puzzles: Low Popularity + High Profitability
These items make great money when they sell, but they don't sell often enough. A $32 pan-seared duck breast with a $7 food cost is a Puzzle if only 3% of guests order it. The profit is fantastic, but it's not contributing meaningfully to your bottom line.
Strategy: Increase visibility and appeal. Move Puzzles to higher-visibility positions on the menu. Rewrite the description to be more enticing. Have servers recommend them verbally. Add a photo (if your menu format allows it). Consider renaming the dish — "Pan-Seared Duck" may intimidate casual diners, but "Crispy Duck with Cherry Glaze" sounds approachable. If nothing works after 60-90 days of effort, the item may simply not fit your customer base.
Dogs: Low Popularity + Low Profitability
These items don't sell and don't make money when they do. Every menu has them, and most operators keep them far too long out of inertia or because "someone might want it."
Strategy: Remove them. A menu with fewer items is easier for customers to navigate, easier for your kitchen to execute, and reduces inventory complexity. If you can't bring yourself to cut a Dog entirely, hide it in the least prominent position on the menu and never feature it on digital signage or specials boards.
How to Classify Your Menu Items
To run this analysis, you need two data points for every menu item: the number of times it was sold over a specific period, and its gross profit per unit (selling price minus food cost).
Pull 90 days of item-level sales data from your POS. For each item, calculate:
- Popularity (Menu Mix %): Number of units sold ÷ Total items sold across the menu. If you sold 12,000 total entrees in 90 days and your grilled salmon accounted for 1,800, its menu mix is 15%.
- Profitability (Contribution Margin): Selling price minus plate cost. If the salmon sells for $26 and the plate cost is $8.50, the contribution margin is $17.50.
Calculate the average menu mix % and average contribution margin across all items in a category (appetizers, entrees, desserts — analyze each category separately). Items above average on both metrics are Stars. Items above average popularity but below average margin are Plowhorses. And so on.
KwickOS makes this significantly easier than manual calculation. The KwickPOS item profitability report shows you contribution margin, menu mix percentage, and total profit contribution for every item. You can filter by category, date range, and even daypart to see how items perform at lunch versus dinner. The system essentially auto-generates your menu engineering matrix.
Pricing Psychology: How Customers Perceive Price
How you present prices matters as much as the prices themselves. Decades of research in consumer psychology have identified several pricing tactics that reliably influence ordering behavior.
1. Remove Dollar Signs
A Cornell study published in the International Journal of Hospitality Management found that guests in a fine-dining restaurant spent 8.15% more when prices were listed as plain numbers (26) versus dollar-sign format ($26.00). The dollar sign triggers what psychologists call the "pain of paying" — it makes the transaction feel more financially significant. For casual dining, the effect is smaller but still measurable at 3-5%.
How to apply it: List prices as "22" or "22.00" rather than "$22.00". This works best on printed menus and digital menu displays. On online ordering platforms, convention requires dollar signs, so don't fight it there.
2. Charm Pricing ($X.95 vs. Round Numbers)
Charm pricing — ending prices in .95 or .99 — signals "value" and "deal." Round numbers ($22, $18) signal quality and simplicity. Neither is universally better; it depends on your positioning:
- Fast-casual and value-oriented restaurants: Charm pricing works. $12.95 feels noticeably cheaper than $13.00 to value-conscious diners.
- Upscale casual and fine dining: Round numbers feel cleaner and more premium. A $28 entree feels more sophisticated than a $27.95 entree.
- Avoid .99 pricing in any sit-down restaurant. It reads as fast-food and undermines perceived quality.
3. The Decoy Effect
The decoy effect is one of the most powerful tools in menu pricing. Add a high-priced "decoy" item near the items you actually want to sell. The decoy makes everything else look reasonable by comparison.
Example: Your steak section lists a ribeye at $38, a NY strip at $34, and a filet mignon at $52. Very few people will order the $52 filet — that's not the point. The filet makes the $38 ribeye (your highest-margin steak) feel like a sensible choice. Without the decoy, $38 feels expensive. With the decoy, $38 feels middle-of-the-road.
This works in beverages too. A cocktail menu with options at $14, $16, and $22 will sell more $16 cocktails than a menu with just $14 and $16 options.
4. Anchor Pricing
The first price a customer sees on a menu section becomes their mental anchor. If your appetizer section leads with a $18 burrata, the $14 calamari and $13 soup that follow feel affordable. If you lead with the $9 side salad, everything else feels expensive by comparison.
How to apply it: Place your highest-priced item first in each menu section. This doesn't mean it needs to be at the physical top of the section — it needs to be where the eye goes first (see Layout section below).
5. Bundling and Packages
Offering prix fixe options, meal combos, or "dinner for two" packages increases average check size because customers perceive bundled pricing as a deal, even when the bundle price exceeds what they would have ordered individually.
A "Dinner for Two: 2 entrees + shared appetizer + shared dessert for $75" package often generates more revenue than two separate checks averaging $32 each, while feeling like a value proposition to the customer.
Menu Layout Science: Where the Eye Goes First
Eye-tracking studies of restaurant menus reveal consistent patterns in how customers scan a menu. Understanding these patterns lets you place your Stars and Puzzles where they'll get the most attention.
The Golden Triangle
On a single-page or two-panel menu, the eye moves in a predictable pattern: center first, then upper-right, then upper-left. This "golden triangle" is where your highest-priority items should live. For a two-panel menu (the most common format), the sweet spot is the center-right area of the right panel.
The Serial Position Effect
Within any list of menu items, people disproportionately remember and order the first and last items. This is the serial position effect, well-documented in memory research and validated in menu studies. Place your Stars at the top and bottom of each section. Bury your Dogs (if you haven't removed them) in the middle.
Boxes and Visual Callouts
Items placed inside a box, highlighted with a different background color, or marked with an icon (a chef's hat, a star, "Chef's Pick") receive 2-3x more attention than unmarked items. Use these callouts sparingly — if every item is highlighted, none are. Reserve them for 2-3 Puzzles you want to promote or Stars you want to reinforce.
Whitespace
Cramming 60 items onto two pages with small font creates decision fatigue. Research from Columbia University shows that consumers presented with too many choices are less satisfied with their selection and take longer to decide — which slows table turns. A well-designed menu with 30-40 items, generous whitespace, and clear section headers outperforms a cluttered menu with 60+ items on every meaningful metric.
Descriptions That Sell
A study published in the Journal of Food Quality and Preference found that descriptive menu labels increased sales of individual items by up to 27% compared to simple labels. But not all descriptions are equal. Here's what works:
Be Specific, Not Generic
- Weak: "Grilled Salmon — Fresh salmon fillet with seasonal vegetables. $26"
- Strong: "Wild Alaskan Sockeye Salmon — Cedar-grilled, served over roasted asparagus and fingerling potatoes with lemon-dill beurre blanc. 26"
The strong version names the specific salmon variety (Wild Alaskan Sockeye), the cooking method (cedar-grilled), and every component of the plate. Specificity signals quality and justifies the price.
Use Sensory and Nostalgic Language
Words that evoke taste, texture, and origin outperform plain descriptors:
- "Crispy" beats "fried"
- "Slow-braised" beats "cooked"
- "Hand-cut" beats "sliced"
- "Grandma's recipe" or "family-recipe" triggers nostalgia and trust
- Geographic origins ("Vermont cheddar," "San Marzano tomatoes," "Gulf shrimp") signal quality and authenticity
Keep It Concise
Two lines maximum per item description. If your description requires three or more lines, you're writing a story, not selling a dish. The description should answer: what's the protein/main component, how is it prepared, and what are the notable accompaniments?
Photo Placement Strategy
Photos on menus are controversial in the restaurant industry. Here's the evidence-based guidance:
- One high-quality photo per page or section increases sales of the pictured item by 25-30%. This is well-documented and consistent across studies.
- More than 2-3 photos per page reduces the premium perception of the restaurant. Menus with many photos read as fast-food or diner-style.
- Photo quality is non-negotiable. A dark, blurry phone photo does more damage than no photo at all. If you can't invest in professional food photography, skip photos on your printed menu.
- Digital menus change the equation. On digital menu boards and online ordering platforms, photos for every item are expected and beneficial. A study by GrubHub found that menu items with photos receive 30% more orders on delivery platforms.
Seasonal Menu Rotation
Static menus leave money on the table. Seasonal rotation serves multiple strategic purposes:
- Ingredient cost optimization. In-season ingredients are cheaper and taste better. A tomato-based dish in August uses $2 worth of tomatoes; in January, the same dish uses $5 worth of inferior hothouse tomatoes.
- Customer excitement. A quarterly menu refresh gives regulars a reason to come back. "Have you tried the new spring menu?" is word-of-mouth marketing.
- Menu engineering refinement. Each rotation is an opportunity to cut Dogs, promote Puzzles, and test new items.
- Marketing content. A seasonal menu launch gives you a natural reason to email your customer list, post on social media, and update your digital signage.
The operational challenge of seasonal rotation is that it requires updating physical menus, training staff on new items, and reprogramming your POS. This is where digital menus have a massive advantage. With KwickOS, a menu change takes minutes — update the item in the system and it's instantly reflected on your POS terminals, online ordering site, and digital menu boards simultaneously. There's no waiting for a print run, no outdated menus floating around, and no confusion among staff about what's available.
Using POS Data to Drive Menu Decisions
Menu engineering without data is just guessing. Here's a quarterly review process that takes about two hours and can reshape your profitability:
Step 1: Pull the Numbers (30 minutes)
From your POS reporting, export the following for the past 90 days:
- Every menu item with total units sold
- Selling price and plate cost for each item (if your POS tracks recipe-level costing, use actual cost; otherwise, use your standard recipe cost)
- Category breakdowns (appetizers, entrees, desserts, beverages)
Step 2: Classify Each Item (30 minutes)
For each category, calculate the average menu mix percentage and average contribution margin. Classify every item as Star, Plowhorse, Puzzle, or Dog.
Step 3: Make Decisions (60 minutes)
- Stars: Confirm pricing, confirm placement. No changes needed unless something has shifted.
- Plowhorses: Identify one profitability improvement per Plowhorse — a small price increase, a cheaper default side, or an upsell add-on.
- Puzzles: Pick 2-3 Puzzles to focus on. Plan repositioning on the menu, description rewrites, server push, or digital signage features.
- Dogs: Remove at least 2-3 Dogs per quarter. Replace them with new items or simply tighten the menu.
Step 4: Measure the Impact (Ongoing)
After implementing changes, monitor the affected items for 30 days. Did the Puzzle's sales increase? Did the Plowhorse's profitability improve? Did removing Dogs simplify kitchen operations? Use your reporting dashboard to track these metrics in real time rather than waiting for another quarterly review.
Digital Menus: The Unfair Advantage
Physical printed menus are static. You can't A/B test them, you can't update pricing in response to food cost changes, and you can't personalize them. Digital menus — whether on in-store displays, kiosks, or online ordering platforms — remove these limitations.
With a digital menu system, you can:
- Change prices instantly in response to ingredient cost fluctuations. If avocado prices spike 40%, you can adjust your guacamole price the same day instead of absorbing the hit for months until your next menu print.
- Run daypart-specific menus. Show your breakfast menu until 11 AM, lunch until 3 PM, and dinner after that — automatically. Feature happy hour pricing only during happy hour.
- Highlight different items by time. Feature your high-margin lunch specials at noon and your premium dinner entrees at 6 PM on the same display.
- Remove sold-out items in real time. 86'd the special? It disappears from the digital menu instantly. No more customers ordering something you can't serve.
- Test and iterate. Try a new description for a Puzzle item, run it for two weeks, and compare sales to the previous two weeks. You can't do this with printed menus.
KwickMenu, the menu management module within KwickOS, connects your POS item database directly to your digital signage, online ordering, and kiosk displays. When you make a change in one place, it propagates everywhere. This tight integration is what makes real-time menu engineering possible for operators who don't have a dedicated menu analyst on staff.
Putting It All Together: A Practical Example
Here's how these principles combine for a casual dining restaurant with a $28 average check:
- Run the matrix: You discover your chicken parmesan ($18, food cost $5.20 = $12.80 margin, 14% of entree sales) is a Star. Your fish and chips ($16, food cost $6.80 = $9.20 margin, 18% of sales) is a Plowhorse. Your duck confit ($29, food cost $8 = $21 margin, 2% of sales) is a Puzzle. Your veggie wrap ($13, food cost $5 = $8 margin, 3% of sales) is a Dog.
- Apply pricing psychology: Move the duck confit to the top of the entree section (anchor). Add a $38 dry-aged ribeye as a decoy. The duck at $29 now looks reasonable instead of expensive.
- Fix the Plowhorse: Raise fish and chips to $17 (a $1 increase customers won't blink at). Switch the default side from coleslaw to a house salad (saves $0.40 per plate). Offer a "Add lobster claw for $8" upsell. Your food cost drops from 42% to 38% on this item, and the upsell adds $6 in profit on 15-20% of orders.
- Promote the Puzzle: Rename "Duck Confit" to "Slow-Braised French Duck Leg, Garlic Mashed Potatoes, Port Wine Reduction." Put it in a highlight box. Feature it on digital signage. Brief servers to suggest it as the "chef's recommendation."
- Kill the Dog: Remove the veggie wrap. Replace it with a seasonal grain bowl at $16 with a $3.50 food cost (a potential new Star).
If these changes move your average check from $28 to $33 — an 18% increase — and you serve 150 covers per day, that's $750 more revenue per day, or roughly $273,000 per year. The menu redesign took a weekend of analysis and a conversation with your printer.
The Bottom Line
Menu engineering is the highest-ROI activity most restaurant operators aren't doing. It requires no new equipment, no additional staff, and no additional marketing spend. It requires looking at your menu as what it truly is — a selling tool — and applying the same rigor to its design that you apply to your recipes.
Start with the data. Classify your items. Apply the pricing psychology principles that match your restaurant's positioning. Optimize your layout. Write descriptions that sell. And then measure the results so you can iterate and improve with every menu cycle.
See Your Menu Data in a New Light
KwickOS gives you item-level profitability, menu mix analysis, and instant digital menu updates across POS, online ordering, and signage. Make every menu decision data-driven.
Get Your Free Demo